April 2011
Article
AutomatedBuildings.com |
[an error occurred while processing this directive]
(Click Message to Learn More) |
|
Finding the Needle
The emerging field of analytics is the key to turning the data from
smart systems into actionable intelligence.
|
|
We finally got our wish! Modern control systems and smart devices give
us access to tremendous amounts of data – environmental conditions,
energy use, equipment operation and many other facets of building
operations. In this data are the keys to better building performance –
trends, correlations, exceptions, deviations, control loop
inefficiencies, and equipment faults – but how do we find them?
The emerging field of analytics is the key to turning the data from
smart systems into actionable intelligence. Analytic tools – software
that has the capability to automatically analyze building, energy and
equipment data to find patterns of interest – can uncover control
issues and equipment faults showing us the path to better facility
operation.
Data Meaning – Semantics
In order to begin the analytics process we have to know the meaning of
our data. For example, if we get a data item from a BAS and it has a
value of 77.6 we can’t do any effective analysis until we understand
whether it is 77.6 degrees F, or PSI, or RPM, or kW, etc. “Units” is
one good example of meaning that we need to begin the analytics
process, but it is by no means the only one.
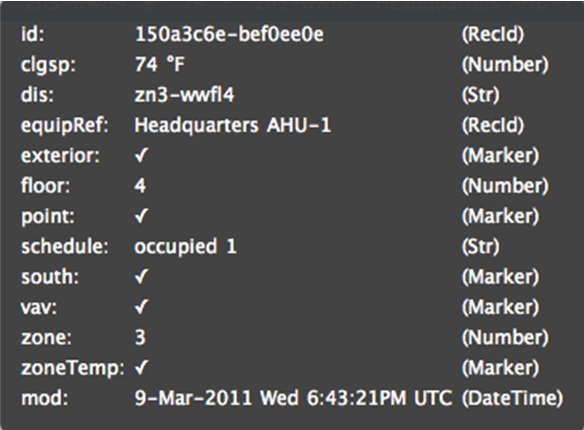
Continuing with our example, perhaps the point with the value of 77.6
is named zn3-wwfl4. If I am familiar with the system and the naming
conventions used when it was installed I may be able to determine that
means Zone 3, West Wing, Floor 4. Now I have a bit of information
to work with. If I know the building well I may also be able to tell
that zn3-wwfl4:
Is a zone temperature
Is an exterior zone
Is south facing
Is supplied by a VAV box
Is served by AHU-1
Is operated on occupancy schedule #1 which is 7:30 AM - 6:30 PM
Has an occupied cooling setpoint of 74 degrees F
This “data about data” is called meta-data. This meta-data enables me
to understand the impact of the current value of 77.6 – I can now see
that it is over temperature during occupied hours and the occupant is
probably getting uncomfortable. Without the necessary understanding of
the data I can’t determine the impact of the current value and its
relationship to proper system operation. In order to provide effective
analytics I need to “map” this meta-data to point zn3-wwfl4.
Interestingly, with all of the power they have gained over the last
decade, most building automation systems provide poor semantic modeling
of the operational data they contain. The systems provide us with a
name and a value but little other information about the specific item.
The result is that a labor intensive, process is typically required to
"map" the data before any analytics can begin.
Mapping Meta-Data
So how can we capture all of this information and associate it with the
data items in our automation systems and smart devices? We cannot do it
simply by trying to use standardized point names. Clearly, in even our
simple example we have more data that can be effectively embodied in a
point name. Add to that the fact that we may want to add numerous other
meta-data items over time and it’s obvious we need another approach.
There are a number of elements to an effective solution.
- Separate the point name from the representation of
meta-data. Use tags to represent the meta-data and associate those tags
with the point name to provide the semantics that will describe the
point.
- Utilize a standardized library of tags to provide
consistency of meta-data terminology, which will enable automated tools
to interpret data meaning.
- Follow a consistent naming convention for data
points so that the mapping of tags can be consistently applied and
automated.
Given our earlier example, a record representing the point with its associated meta-data might look like:
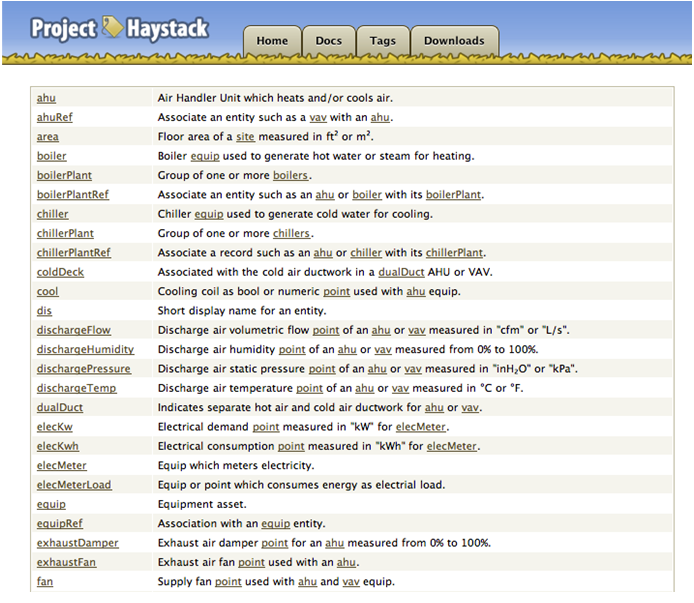
Project Haystack
Helping the industry move forward with meta-data and naming conventions
is where Project-Haystack comes in. Project Haystack is an open source
initiative to develop tag naming conventions and taxonomies for
modeling of building equipment and operational data. The project is
developing standardized data models and tag libraries for sites,
equipment, and points related to energy, HVAC, lighting, refrigeration
and other environmental systems. Substantial libraries of tag names and
proposed taxonomy models are already in place.
A key factor in the need for Haystack is the reality that we have
millions of points in thousands of systems out there and those point
names are not going to change. It’s simply not an option – and it isn’t
necessary. What we need is a standardized model for applying meta-data
to enable us to associate meaning with those point names. Project
Haystack will provide this.
Who Should Participate?
[an error occurred while processing this directive]
Project Haystack encompasses the entire value chain of building systems
and related intelligent devices. Owners and consultants can specify
that Haystack conventions be used in their building automation systems
to ensure cost effective application of analytics tools (and other
software applications), and management of their buildings for years to
come. System integrators and manufacturers who integrate Haystack
support into their projects and products are positioned for the future
of value added services and can streamline the process of turning data
into actionable intelligence.
Response to the project has been overwhelmingly positive since its
launch in early March. Building owners, equipment vendors, ESCOs,
systems integrators, and Governmental organizations are all coming
together to help move this essential project forward.
Pragmatic use of semantic naming conventions and taxonomies are
essential to make analytics more cost effective and to enable us to and
derive value from all of the operational data we now have access to.
Please consider joining the effort – its open to everyone interested in
the continuing journey of building efficiency. You can check it out and
learn how to participate at http://project-haystack.org/
About the Author
John Petze, C.E.M., is a partner in SkyFoundry, the developers of
SkySpark™, an analytics platform for building, energy and equipment
data. John has over 25 years of experience in building automation,
energy management and M2M, having served in senior level positions for
manufacturers of hardware and software products including Andover
Controls, Tridium, and Cisco Systems. At SkyFoundry he rejoins Brian
Frank, co-founder and chief architect of Tridium’s Niagara Framework,
as they look to bring the next generation of information analytics to
the “Internet of Things”.
footer
[an error occurred while processing this directive]
[Click Banner To Learn More]
[Home Page] [The
Automator] [About] [Subscribe
] [Contact
Us]