Analytics do not have to be complicated to deliver valuable, actionable results that save facility operators real dollars.

|
August 2011 |
[an error occurred while processing this directive] |
|
“Would you run your business without financial analysis
tools?” Analytics do not have to be complicated to deliver valuable, actionable results that save facility operators real dollars. |

|
| Articles |
| Interviews |
| Releases |
| New Products |
| Reviews |
| [an error occurred while processing this directive] |
| Editorial |
| Events |
| Sponsors |
| Site Search |
| Newsletters |
| [an error occurred while processing this directive] |
| Archives |
| Past Issues |
| Home |
| Editors |
| eDucation |
| [an error occurred while processing this directive] |
| Training |
| Links |
| Software |
| Subscribe |
| [an error occurred while processing this directive] |
Would
you, could you, operate a successful business without the ability to
track revenue against costs, performance of business units,
productivity of salespeople, return on investment of new initiatives?
Would you manufacture a product without looking at the costs of its
components and opportunities to reduce those costs?
It pretty clear none of us would do that if we wanted to stay employed
and have a successful business. Yet in many cases these fundamental
techniques are not effectively used to manage the costs associated with
the operation of our facilities.
Buildings consume 30% of the total world energy consumption and we
routinely accept their energy costs without knowing where those costs
go and whether they could be reduced.
With the huge volume of data that
modern building automation systems
and equipment systems produce we “should” know everything about the
operation of our facilities. Interestingly, however, too much data
looks surprisingly like no data at all. If I can’t find essential
information then I might as well not have it.
This isn’t a new problem for business, however. Financial managers long
ago learned the necessity of using software to assist in managing and
analyzing the vast quantities of data produced by business operations.
Business intelligence and analytics software automatically identifies
important trends, issues and potential problems, bringing them to the
attention of busy managers who can then take necessary action.
[an error occurred while processing this directive]Today,
specialized analytics tools are being applied to analyze the
operation of equipment systems, energy consumption and costs, and
facility operations activities as a whole. The result is the ability to
move to data driven management of our building equipment systems and
physical assets.
Where does analytics fit in delivering tangible business value to an
organization?
An example in energy management –
Automatically identifying deviation from baseline energy consumption
Establishing a desired baseline or target for energy consumption is a
key part of most energy efficiency projects, whether it is a lighting
retrofit or replacement of HVAC equipment. We expect the project to
result in a new lower energy consumption profile for the facility. This
target is typically expressed as a design baseline. An important part
of verifying the results of such a project is to track actual
performance against this baseline. This can be done manually, but what
if you had the ability to automatically compare energy consumption
after the project against that desired operating baseline and be
informed of all of the periods of time when electrical demand (or
consumption) went above the baseline by more than 3% (or any amount of
your choosing).
An analytics system can do this for you. It will find periods of time
that deviate from desired operation and automatically inform you of the
issue, delivering a clear, understandable display showing just when and
where deviations have been found. No hunting for data – the system can
tell you that the condition has been found. A simple mouse click takes
you to a detailed view of the issue, the time of occurrence, the
duration and which sites or meters were found to be deviating from the
desired baseline, and, the actual cost of those deviations.

Example of Equipment Operation: How
frequently and how long do buildings run in emergency override?
Exceptions happen. Building systems need to be put into emergency
override mode for a variety of reasons. But how long do they stay
overridden and how much does it cost?
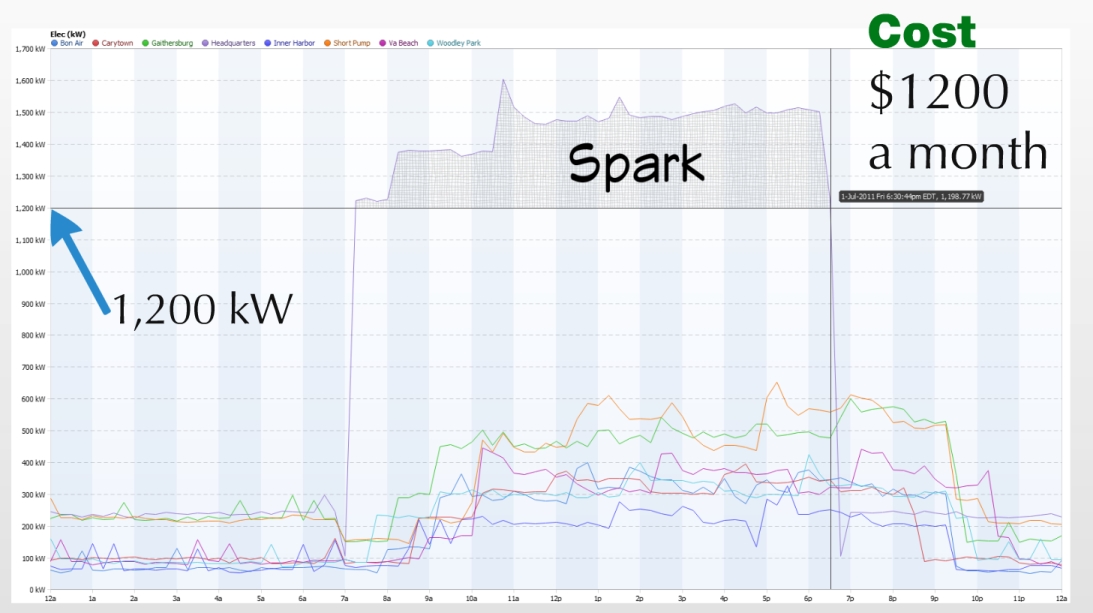
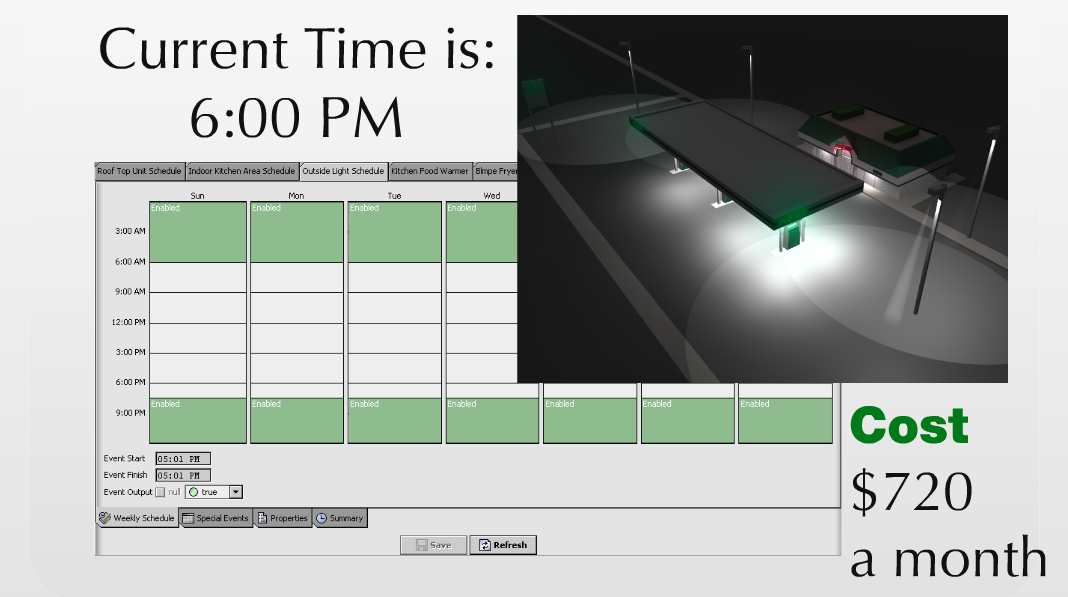
The Solution – A rule or algorithm can automatically track the number of hours that sites are in override mode. A report then provides managers with a clear view of the number of hours of override operation by site and across the portfolio. The impact can be significant.
The
Result – Actionable information that can be used to drive
reductions in energy costs.

These are two simple but real
examples, which brings out another key
point – analytics do not have to be complicated to deliver valuable,
actionable results that save facility operators real dollars.
As they say, information is power. In facility management actionable
information produced by a new generation of analytic software is the
key to lower energy and operating costs and better building performance.
About the Author
John Petze, C.E.M., is a partner in SkyFoundry, the developers of SkySpark™, an analytics platform for building, energy and equipment data. John has over 25 years of experience in building automation, energy management and M2M, having served in senior level positions for manufacturers of hardware and software products including Andover Controls, Tridium, and Cisco Systems. At SkyFoundry he rejoins Brian Frank, co-founder and chief architect of Tridium’s Niagara Framework, as they look to bring the next generation of information analytics to the “Internet of Things”.
[an error occurred while processing this directive] [Home Page] [The
Automator] [About] [Subscribe
] [Contact
Us]
[Click Banner To Learn More]