A Path to Fast Financial Returns

John Petze,
Principal,
SkyFoundry
|
August 2012 |
[an error occurred while processing this directive] |
|
Using Data Analytics to Improve Facility Performance A Path to Fast Financial Returns |
John Petze, Principal, SkyFoundry |
| Articles |
| Interviews |
| Releases |
| New Products |
| Reviews |
| [an error occurred while processing this directive] |
| Editorial |
| Events |
| Sponsors |
| Site Search |
| Newsletters |
| [an error occurred while processing this directive] |
| Archives |
| Past Issues |
| Home |
| Editors |
| eDucation |
| [an error occurred while processing this directive] |
| Training |
| Links |
| Software |
| Subscribe |
| [an error occurred while processing this directive] |
Buildings owners are being presented with a wide range of options that
promise to help them reduce energy and operating costs. The vast
majority of these require significant capital investments. Many are
what you would call “big projects” – lots of engineering, significant
time required to deploy, and big financial commitments before any
benefits will be realized.
Yet one of the most effective ways for facility managers to reduce
costs doesn’t get delivered by a truck and doesn’t require a huge
capital outlay to start generating savings. The option I am
referring to is using data analytics to identify operational issues
that have the most immediate and significant financial benefits.
Analytics technology is fundamentally changing business and society
bringing us to levels of efficiency not previously attainable.
Analytics is being used by police departments to improve crime
prevention and response, its being used in health care to improve
diagnosis and treatment, and of course it is being used all over the
web to improve sales results by more effectively identifying customer
needs and buying behaviors. It’s only logical that we should be using
this new technology to better operate our buildings. That’s the role of
“operational analytics” and the great thing is that it’s easy to get
started with analytics in our buildings.
Analytics Will Identify Waste and Inefficiency
Analytics show us how our buildings really operate (not how we think
or hope they do), identifying exactly where opportunities for savings
exist. Analytics software automatically analyzes operational data
coming from equipment and control systems and identifies patterns that
represent waste, equipment faults, deviations from desired performance,
and opportunities for savings. The results enable you to know where to
focus to drive operational improvements that reduce costs. Simply put,
analytics enables you to turn the data from your building systems into
money.
Analytics Can Deliver Fast Results
Unlike energy conservation measures that involve the installation of
major capital equipment, you can start small with analytics and
generate returns in a very short period of time. The results from those
initial analytics generate the savings to go deeper into your
operational data. Let's look at an example…
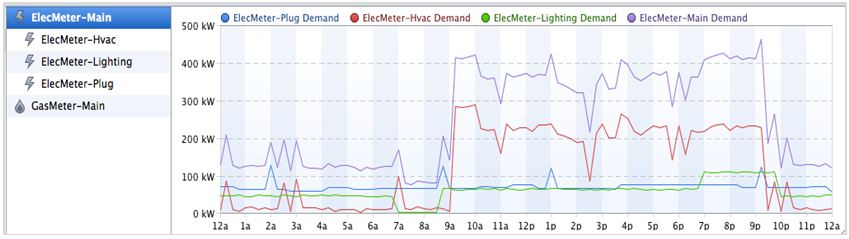
Let’s say the only data I can easily access is my interval meter data
(kW demand), which is provided once per day by my utility company, and
a list of occupancy schedule times in an Excel™ spreadsheet. Can I gain
any valuable insight from that little amount of data? The answer is a
resounding YES! With just that limited amount of data SkySpark
can identify:
- Buildings starting early
- Buildings running late
- Buildings that operate continuously
- Demand peaks that occur outside of occupied times
- Peak Load, Annual & Monthly and Short Load Durations
Here’s how. With typical energy analysis tools I can identify my kW
demand pattern for each day. By looking at it manually I can assess
whether the pattern follows expected occupancy times. But who has time
to do that manually? I don’t!
The solution – an analytics rule looks for a percentage change in kw
demand at the transition to and from occupancy. The rule identifies
when buildings run late, and start early. A weekly view shows how many
times the issue has occurred and even calculates the cost of those
events. Analytics takes me right to the issue. There’s no need to hunt
through the data manually!
[an error occurred while processing this directive]
Delivering Financial Returns
Analytics delivers real, financial results and rapid ROI. Here’s
another real world example based on a simple issue that many buildings
have –equipment operating outside of occupancy times.
The Business Issue: Exceptions happen – buildings need to be put into
override mode for a variety of reasons – but how long do they stay
overridden and how much does it cost? Do they get put back in automatic
mode?
The Solution – An analytic rule tracks the hours sites are in override
mode. Auto-generated reports provide managers with a clear view of the
number of hours of override by site and across the portfolio with costs.
The Result – Analytics produces actionable information that is being
used to drive reductions in energy costs projected at $1.8 million
annually across 925 sites through changes to operational practices to
address just this one issue.
The important story here is that analytics doesn’t have to be complex
or expensive to start delivering actionable information and tangible
results. It’s the optimal way to take advantage of the wealth of
information in your equipment systems to drive energy and operational
improvements.
About the Author
John Petze, C.E.M., is a partner in SkyFoundry, the developers of
SkySpark™, an analytics platform for building, energy and equipment
data. John has over 25 years of experience in building automation,
energy management and M2M, having served in senior level positions for
manufacturers of hardware and software products including Tridium,
Andover Controls, and Cisco Systems. At SkyFoundry he rejoins Brian
Frank, co-founder and chief architect of Tridium’s Niagara Framework,
as they look to bring the next generation of information analytics to
the “Internet of Things”.
[an error occurred while processing this directive]
[Click Banner To Learn More]
[Home Page] [The Automator] [About] [Subscribe ] [Contact Us]