Find the actionable information hidden in smart meter data.

Dave Krinkel
Founder
EnergyAi™
|
December 2011 |
[an error occurred while processing this directive] |
| “Unexpected” Savings Find the actionable information hidden in smart meter data. |
Dave Krinkel Founder EnergyAi™ |
| Articles |
| Interviews |
| Releases |
| New Products |
| Reviews |
| [an error occurred while processing this directive] |
| Editorial |
| Events |
| Sponsors |
| Site Search |
| Newsletters |
| [an error occurred while processing this directive] |
| Archives |
| Past Issues |
| Home |
| Editors |
| eDucation |
| [an error occurred while processing this directive] |
| Training |
| Links |
| Software |
| Subscribe |
| [an error occurred while processing this directive] |
“I didn’t expect that.”
These four words planted the seeds for a new company. They were uttered some years ago by an Associate VP of Facilities for a university with a 100 building portfolio. We had just installed an energy management system (EMS) that gave his team access to real-time and historical energy use. We were looking at the electric load profile for an administration building whose operating hours were recently curtailed. Saturdays should have looked like Sundays, but the load was still rising in the morning and falling in the evening. A quick investigation revealed that not all HVAC controls had been rescheduled.
Lesson #1: our buildings’ actual patterns of energy use are often different than what we expect. And a simple load history can lead to operational savings. But facility managers do not have the time to pore over load profiles looking for unexpected patterns.
“That doesn’t look right.”
Fast-forward a couple of years, to a training session at a Fortune 500 company for their new enterprise EMS. Because the company’s IT department would be maintaining the EMS servers, they sent one of their people to the session even though she knew nothing about energy management. But out of the whole class, she was the only one who noticed that electric demand in one of their office buildings rose late at night on the first Wednesday of each month. It turned out that as part of a monthly maintenance routine, lights were turned on for a bank of floors and left on throughout the night.
Lesson #2: you can identify some savings opportunities even if you don’t know anything about a facility, such as its size, construction, installed equipment, hours of operation, location, etc. All you need is a history of interval energy use, from which you can identify “typical” patterns and anomalies.
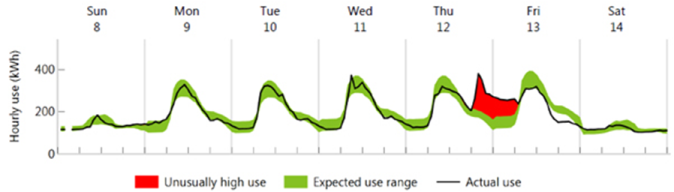
This process of pattern analysis which the human eye intuitively does can be automated, and extended to tease out patterns that may not be so immediately obvious. For example, a careful examination of unusually high electric demand can distinguish between “spikes” when load jumps (as in Thursday evening in the following chart):
versus the load remaining constant when it normally drops (as in Saturday afternoon in the following chart):
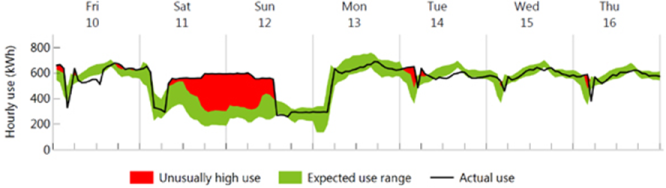
The
first example suggests that some “unusual” equipment was turned on
around 6pm that Thursday. The second example suggests that equipment
which is usually turned off around midday on Saturdays was left on.
Each of these points to a different cause and remedy. We often see
facilities in which one of these patterns occurs frequently over a
year, adding significantly to the electric bill.
[an error occurred while processing this directive] The new company referred to at the beginning of this article is EnergyAi™ (www.energyai.com). It was founded on two principles:
Until recently, obtaining historic interval energy data was expensive. Large energy users might be able to get it from their electric utilities for a monthly fee, or organizations could install an in-house EMS with sub-meters and IDR’s. But today there are over two million commercial and industrial smart meters in the U.S., and that number is rapidly growing. There are even more in Europe, Asia, and elsewhere. Most utilities rolling out smart meter programs provide customers with free, secure access to their historic use.
So the heavy lifting of collecting, storing, and publishing the interval data needed by EnergyAi™ is already happening for millions of buildings. This makes the second founding principle above possible. Our clients download a file containing a year of historic hourly or subhourly use data from their utility or in-house system, and send it to us via our website. We email back a Load Analysis report. The cost is $20.00 per report.
It’s important to stress what this type of analysis is not. It is not an energy audit. It cannot recommend specific retrofits. Instead, the Load Analysis report shows your building’s energy behavior from the meter’s perspective. EnergyAi™ answers the following questions:
Every facility manager should have the answers to these basic questions. And thanks to smart meters and other advances, it is now easy and very inexpensive to find the unexpected energy savings opportunities in any building.
About the Author
Dave Krinkel is the founder of EnergyAi™ (www.energyai.com), based in
Berkeley, CA. In 1978 he was a researcher in the pioneering Energy
Efficient Buildings team at Lawrence Berkeley National Lab. For the
last 25 years, Dave has developed energy analysis tools for utilities,
ESCO’s, and a wide variety of industrial, commercial, and institutional
end users. Prior to EnergyAi™, Dave held senior positions at Itron,
Silicon Energy, and SRC Systems. He can be reached at
dkrinkel@energyai.com.
[an error occurred while processing this directive]
[Click Banner To Learn More]
[Home Page] [The Automator] [About] [Subscribe ] [Contact Us]