January 2010
![]()
AutomatedBuildings.com
[an error occurred while processing this directive]
(Click Message to Learn More)
January 2010 |
[an error occurred while processing this directive] |
|
|
Sarah Erdman, |
According to the U.S. Green Building Council (USGBC), in the United States alone, buildings are one of the heaviest consumers of our natural resources, responsible for 72 percent of electricity consumption, 39 percent of energy use, and 38 percent of all CO2 emissions. As the push for green building increases, so does the efficiency of existing buildings. In the current economy and competitive environment, facility managers must be responsible for the knowledge and management of their building’s resource use.
|
|
|
|
|
|
|
|
|
|
|
|
|
[an error occurred while processing this directive] |
|
|
|
|
|
|
|
|
|
|
|
|
|
|
|
[an error occurred while processing this directive] |
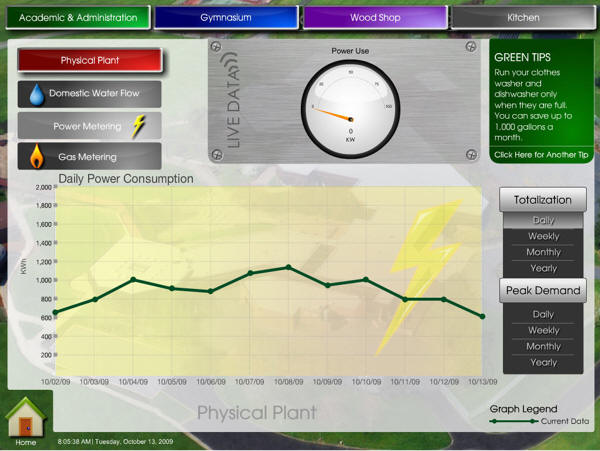
More building automation systems are providing this
important data, but reviewing the individual data points can be difficult.
Dashboards can be used to display this information in a more accessible format,
showing the big picture through charts and graphs that can easily be understood
by those that don’t have specific knowledge about facility operations. Today,
everything is driven to be more efficient; reviewing a building’s utility usage
can improve accountability and help develop more efficient strategies.
Maximizing a building’s efficiency not only improves the return on investment,
but can also decrease operating costs, reduce natural resource use and improve
the occupants or publics’ perception of the building.
QA Graphics, a graphics development company that specializes in control system
graphics and energy dashboards, provides a cost-effective solution to easily
communicate a building’s utility data. The solution is the Energy Efficiency
Education Dashboard (EEED). It’s used to track energy or water consumption,
allowing facility managers to determine how effective their systems are and
monitor strategic initiatives.
We work in conjunction with building integrators to incorporate the EEED, as an
affordable option to display and review building utility data. A recent example
of this is a facility team utilizing an energy dashboard at Chemawa Indian
School. Environmental Controls Corporation worked with QA Graphics to integrate
the dashboard with the school’s BAS. “The EEED gives the owner immediate and
easy access to all of the monitored systems to include real time and historical
data,” said Don Lawrence, project manager from Environmental Controls. “The
owner can use this information to manage their systems in a variety of ways to
conserve energy, such as peak demand, demand limiting, and water conservation
measures. When a dashboard is not in place, the owner is required to gain access
to the control system’s trend log data.”
[an error occurred while processing this directive]
The EEED is used by the facility team to review the school’s dormitory,
gymnasium, woodshop and kitchen’s domestic water flow, electricity and gas use
in real-time daily, weekly, monthly and yearly statistics. The school had
noticed a high spike in energy use in the mornings. “We had an idea where the
high spike was coming from, but now that the new control system and EEED is in
place, we’ve been able to verify that this spike is from the dormitory,” said
Shaun Naranjo, Chemawa facility specialist.
The school is working on small steps to encourage efficiency and now that the
usage can be viewed in real-time and for specific locations, Chemawa will be
able to develop additional strategies to help conserve water, gas and power.
Facility managers can work with their internal IT professionals to determine how
a dashboard is integrated into the facility’s network, eliminating network
security vulnerabilities. It’s used as a supplement to communicate building data
that is being collected. The EEED uses specially developed hardware to read
communication networks’ language. It’s capable of displaying information
communicated through BACnet IP, BACnet MS/TP, LONWorks and Modbus devices. If a
BAS is in place, the EEED can easily display any utility data that the BAS
collects. The hardware takes the data and cleans it up to display the
information in an easier to understand format. If a BAS is not in place, as may
be the case for older buildings, the hardware compiles the information from the
devices used to monitor the building’s utilities and then calculates the data to
display it. The data can be viewed online or on a hardware device, such as a
touchscreen. Dashboards are also commonly used to showcase a building’s efforts
to the public. It’s an interactive way to educate others about efficiencies or
sustainable features already in place.
[an error occurred while processing this directive]
[Click Banner To Learn More]
[Home Page] [The Automator] [About] [Subscribe ] [Contact Us]