
|
January 2012 |
[an error occurred while processing this directive] |
|
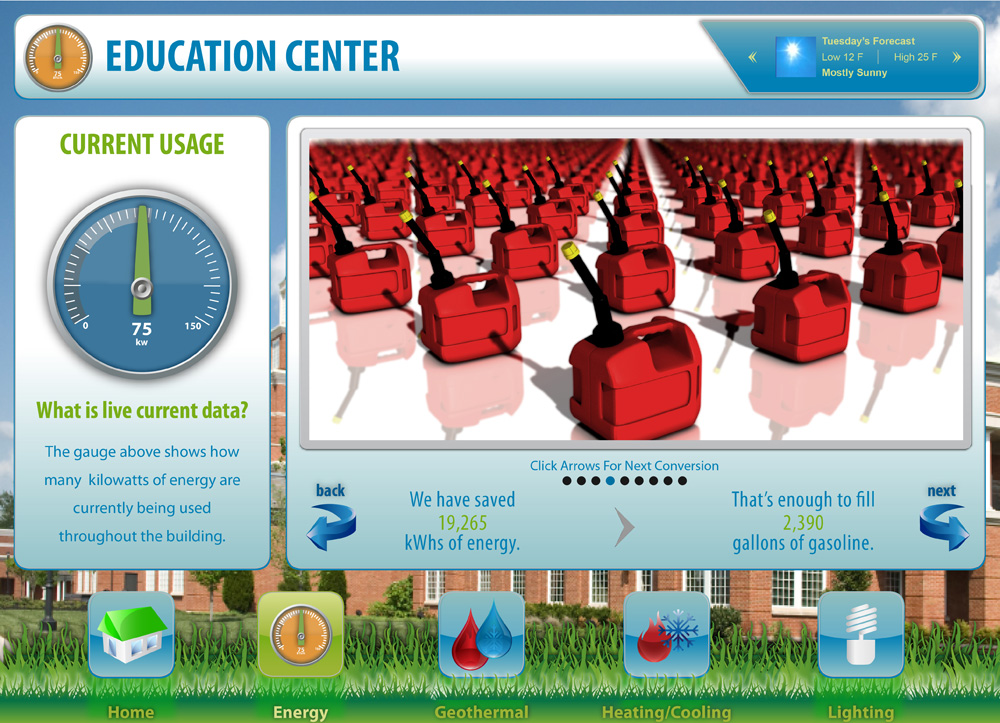
Energy
Dashboards Are Evolving
As energy
dashboards
continue to evolve, building performance will be something that’s more
visual and more accessible for everyone, anywhere, anytime. |
| Articles |
| Interviews |
| Releases |
| New Products |
| Reviews |
| [an error occurred while processing this directive] |
| Editorial |
| Events |
| Sponsors |
| Site Search |
| Newsletters |
| [an error occurred while processing this directive] |
| Archives |
| Past Issues |
| Home |
| Editors |
| eDucation |
| [an error occurred while processing this directive] |
| Training |
| Links |
| Software |
| Subscribe |
| [an error occurred while processing this directive] |
Technology is rapidly
changing the building industry and the momentum
doesn’t look to be slowing down anytime soon. Energy dashboards have
evolved significantly during the past few years; originally for the
purpose of reviewing complex building information, now it’s commonplace
to share this information with the building occupants.
Interactive technology has allowed this energy data to be more visual,
and more importantly – more accessible.
Adding occupants to the equation has greatly changed how energy
dashboards are presented. For occupants, this information must
have more of an educational focus and be easier to understand than the
technical monitoring that an operations team would review. This
is something that QA Graphics continues to focus on. The company has
been an industry leader in making building concepts more visual, from
BAS graphics for behind the scenes, to high-end equipment models and
animations for marketing needs, and energy dashboards for the purpose
of educating building occupants. The company has helped
define how the solutions should differ when used by the two audiences,
how facility management relies on energy dashboards for key performance
indicators, whereas occupants need much more basic data for
education. We have worked to introduce the term, energy
education dashboards, to clarify the importance of the educational
aspect for occupants. The company has presented this concept at
several industry conferences, including the 2011 Green California
Schools Summit, 2011 Iowa Energy Summit, and the 2010 Sustainable
Solutions Conference, highlighting how education is a big
differentiator when sharing building data with occupants.
Another
factor that may change the use of energy dashboards in 2012 is
how organizations can further involve occupants as part of their energy
reduction strategies. A recent study shows that occupants can make a
larger impact on overall building performance than previously thought.
The study, Sensitivity Analysis: Comparing the Impact of Design,
Operation, and Tenant Behavior on Building Energy Performance, released
by the New Building Institute, was designed to compare operational
energy-use characteristics to the impact of what is typically
considered building design characteristics. In summary, the study
shows that occupants have a greater impact on building performance than
thought, illustrating that not only is the design of a building
detrimental to building performance, but also the operation and policy
strategies. As a result, the study recommends “the
installation of submetering and energy-use dashboards can contribute to
effective strategies to help tenants understand and reduce their energy
usage” (NBI 27).
Providing
a dashboard with this continuous feedback is a great start
for occupant awareness, but a long-term plan beyond just showing the
data is also required. The information must educate and keep occupants
informed, as part of an organization’s ongoing strategies to encourage
lifestyle changes and not just temporary efforts. A third-party
dashboard, separate from the building management system, is ideal
because it allows the solution to be aligned with the organization’s
overall initiatives for the occupants without having to worry about the
technical requirements that a dashboard used behind the scenes must
consist of.
QA
Graphics has been at the forefront of this industry, having provided
their Energy Efficiency Education Dashboard solution for years now and
recommends using a third-party solution like this for occupant
awareness. Using a third-party solution complements the
traditional energy management system. It’s not performing the
monitoring, but taking the data that’s already available and presenting
it in a way so that it’s more visual and easy to understand. It
also allows an organization to be more creative and engage the
occupants with interactive features like demos, games and quizzes. The
solution can also be much more social, with fun competitions to
encourage resource savings. Another benefit is that third-party
solutions are protocol based, and therefore not tied to a single
building automation system vendor. If a facility changes vendors or
makes an upgrade to their building management system, the educational
dashboard can still function properly.
It’s an exciting time to help organizations share this information and
get occupants involved in their initiatives. As energy dashboards
continue to evolve, building performance will be something that’s more
visual and more accessible for everyone, anywhere, anytime. As
technology continues to evolve, so will the industry, changing to be a
more interactive, social, and mobile market.
About QA Graphics
QA Graphics works with organizations of all types throughout North
America providing their solution, the Energy Efficiency Education
Dashboard, to help educate and inform occupants about building
efficiency. For more information, visit www.qagraphics.com/eeed.
Stop by QA Graphics’ booth #3729 at the AHR EXPO and be sure to attend
their presentation on how energy dashboards can creatively communicate
building performance to occupants in the new product technology theater
at 4:30, Tuesday January 24.
References:
Jonathan Heller and Morgan Heater, Ecotope; Mark Frankel, New Buildings
Institute (NBI). Sensitivity Analysis: Comparing the Impact
of Design, Operation, and Tenant Behavior on Building Energy
Performance. July 2011.
[an error occurred while processing this directive]
[Click Banner To Learn More]
[Home Page] [The Automator] [About] [Subscribe ] [Contact Us]