|
January 2016
Article
AutomatedBuildings.com
|
[an error occurred while processing this directive]
(Click
Message to Learn More)
|
|
Building Automation System Intrinsic Analytics
Before heading
for third-party
applications in the cloud, explore what is possible with the analytic
features already built into your building automation system.
|

Steve Tom,
PE, PhD
Retired
AutomatedLogic
|
The
buzzword “analytics” is often applied to stand-alone computer programs
that extract data from a building automation system (BAS), analyze it,
and provide suggestions on how to make the system run more
efficiently. Those systems can be very useful, but a third-party
program is not always required to perform analytics and they do not
always need to run in the cloud. There are many ways in which analytics
are performed by the existing building automation system. Intrinsic
analytics are built into the core product and do not require external
programs or expensive data mapping to deliver their insights. This
makes them useful to customers who may not want expensive add-on
services, or whose security requirements do not permit them to export
data to the cloud.
Analytics for Central Versus
Distributed Control
Some sophisticated analytic functions require data from
the entire system. It makes sense to implement those functions in a
central computer, whether this computer is local or in the cloud. To
search for new patterns, it is best to start with a large sample of
trends pulled from multiple parts of the system. Looking for
correlation between random streams of data is not an automatic search
performed by the computer. These are performed as guided searches,
using rules developed by an operator who understands how the system
should operate by looking for anomalies that might indicate a problem.
The rules might compare the performances of identical chillers when
operating with similar loads. If one chiller consistently outperforms
the other, that might indicate a problem. It would take additional
searches with additional rules to determine the exact nature of the
problem, but a central analytics system makes it easy to conduct these
additional searches.
There is a contrasting case for analytics when you are
setting up rules to detect common problems in a single piece of
equipment. These rules essentially implement logical comparisons,
which a knowledgeable operator would use to detect pending failures or
the need for maintenance on particular equipment or subsystems. In this
case, it makes sense to implement algorithms at the level at which the
data is available. Analytics intrinsic to the BAS system have an
advantage in distributed control scenarios.
Don’t overlook the fact that the user interface itself
can be a powerful analysis tool. It has often been said that “a
picture is worth a thousand words,” and the user interface provides
trend graphs, summary graphics and other visuals that help the user see
what is happening with their system. These can be particularly
useful when combined with rule-based analytics, as the rules can tell
the user that something is
wrong with a particular piece of equipment and the user interface can
help the user zero in on the specific problem.
Automated Logic Corporation (ALC) is constantly
researching potential enhancements to its WebCTRL® building
automation system, including new analytics packages. The company is also
evaluating emerging technologies such as semantic tagging. Common
practices at the data model level will make it easier for stand-alone
analytic programs to make sense out of the data they extract from a
BAS, since mapping this data into current analytic packages can be an
expensive proposition. While these enhancements will make analytics
more accessible in the future, you don’t need to wait until then to
begin using analytics. Below are examples of intrinsic analytics
that are available today.
Thermographic Floor Plans
For
more than 20 years, ALC systems have compared the actual temperature of
a room to the desired temperature (setpoint) and presented the
difference as a thermographic color map. The information needed to
calculate a thermographic color map is present at every zone. In fact,
that calculation is already being performed at the zone-level for many
control actions. It is a simple matter for each zone to communicate a
single value that represents thermographic color to the BAS user
interface. It would be more expensive, more complex, and contrary to
the principle of distributed control for an external program to extract
all the data needed to do these calculations from the zones to present
a thermographic floor plan as part of a separate analytics program. The
rules are known, they do not change, and the calculations are easily
performed within the BAS, so it makes perfect sense to implement this
as intrinsic analytics. An example is provided as Figure 1.
It doesn’t take a sophisticated pattern recognition algorithm to see
that there’s a problem with the air conditioning in the south-west
corner of this building.
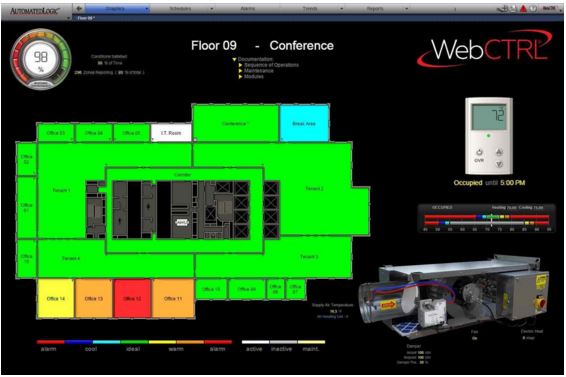
Figure
1: Thermographic Floor Plan
Reporting
Reporting has long been one of the basic functions of a
building
automation system. Although not typically considered an analytic tool,
reports do provide a way to sort through a huge amount of data to spot
anomalies. For example, sensor failures and other equipment
malfunctions sometimes make it necessary to lock points until the
underlying problem is repaired. Locking points puts the equipment in a
manual control mode, allowing it to provide essential service. Often
this comes at the price of bypassing schedules or other energy saving
features and should be used only for a temporary fix. However,
operators often forget to unlock the point when the need has passed. An
external analytics package could analyze reams of data looking for
indications that a point is locked, but it is much more efficient to
simply let the BAS run a locked points report.
Trending
Trending is an extremely powerful data visualization
tool. The recent
addition of scatter plots to the WebCTRL system’s trending arsenal
makes it even more powerful. The trends highlighted in Figure 2 show
the performance of two identical chillers. Chiller 1 was clearly using
more energy than chiller 2, particularly at high loads. The data
pattern communicated by this graph triggered further investigations
which eventually revealed a misconfigured head pressure sensor on
chiller 1. Fixing this sensor reduced energy use by chiller 1 to the
same level as that of chiller 2.
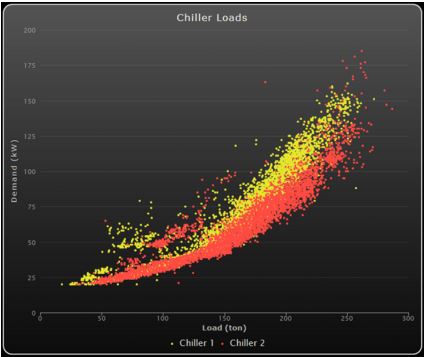
Figure
2: Trend Graph Comparison of Chillers
Traditional trend graphs are also a very effective tool
for
troubleshooting problems in heating, ventilating and air conditioning
(HVAC) equipment. For example, Figure 3 shows trends from a variable
air volume (VAV) box with a hot water reheat valve. The top trend shows
airflow through the box. The zone became occupied at 6 a.m. and shows
good flow control at the flow setpoint. The next trend down shows the
discharge temperature from the VAV box in yellow compared to the supply
air temperature coming from the air handling unit (AHU) in blue.
From 6 a.m. to 6:45 a.m. these two temperatures were the same, as
expected since the reheat valve was completely closed (third trend
down). From 6:45 a.m. to 7:30 a.m., the discharge air temperature rose
to about 80 °F, despite the fact that the reheat valve remained closed.
It rose again between 8 a.m. and 11:30 a.m. Why did the discharge
temperature rise during these two time periods? The bottom trend shows
those were the time periods when the boiler system was active and hot
water was pumped to all coils within the building. The control valve
for this coil was leaking hot water into the coil, even though the
trend graph shows the valve was supposed to be completely shut. This is
an example of an equipment problem that wastes energy and makes people
uncomfortable. The zone did not need heat, but the system was using
energy to blow hot air into the zone anyway.
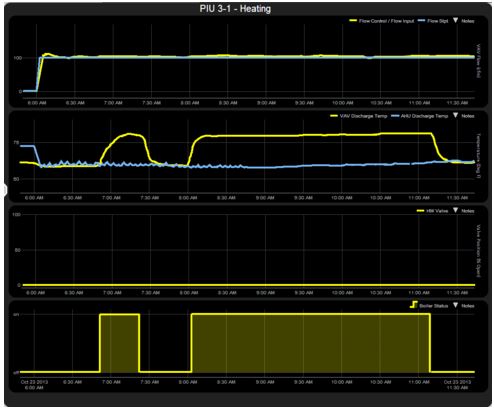
Figure
3: Trends from VAV Box with Faulty Reheat Valve
Alarms
Trend graphs are a good way to troubleshoot a problem
once you know it
exists, and they help guide a user into taking the right action.
However, life is too short to spend hours staring at trend graphs
hoping to spot problems. Hence, BAS alarms can be helpful in
identifying that there is a problem. Alarm logic can reside
unobtrusively in the system for years, unseen and unappreciated, until
there is a problem. Then it springs into action, popping up a message
on the user interface and generating a warning sound. It can generate
messages on other screens as well, such as a central security
monitoring station. The alarm can also send e-mails to key personnel,
record data in indelible alarm logs, launch additional programs, and
persist as an “acknowledged but still active” entry in the user
interface.
When it comes to fault detection and diagnostics (FDD) alarms, it is
recommended to confirm that the equipment in question really does have
a problem than to report a problem that does not exist. The challenge
is to define a set of conditions that will detect a malfunction and not
generate false alarms. For example, if an air handling unit activates a
direct expansion (DX) cooling stage you expect the discharge air
temperature to drop. If you are programming this into alarm logic, you
must be specific. For example, if you expect the temperature to drop
0.5 °F within five minutes, and the wind changes and more hot outdoor
air is blown into the system, the temperature may only drop, 0.4 °F. If
the FDD logic generated an alarm because the temperature did not drop
as expected, it would be a false alarm that would undermine the user’s
confidence. However, if the DX cooling stage actually is broken, it
will fail every time the controller tries to turn it on. To avoid false
alarms, the FDD logic can keep track of the failures. As an example, if
it fails to start seven out of 10 times, it will signal to generate an
alarm. This strategy means it takes longer to generate an alarm, but it
decreases the chances of generating a false alarm.
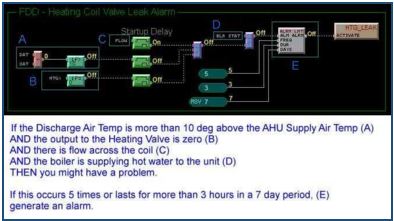
Figure 4 illustrates the type of advanced
false-alarm-avoiding FDD rule
set to find the leaking hot water valve that was responsible for the
trend graph shown in Figure 3.
Figure
4: Alarm Logic for Hot Water Valve
[an error occurred while processing this directive]
Data Storage and Handling
By definition, analytics involve the processing of data,
which makes
the storage and handling of data a key part of any analytics process.
With its high bandwidth IP and ARC156 networks, distributed trending,
and support for multiple industry standard databases, the WebCTRL
system already provides a data friendly environment. Future releases of
the WebCTRL system will include significant improvements in trend
processing that will provide a 12x speed improvement in trend retrieval
and a 120x improvement in trend storage. Whether this data is needed
for a trend graph, a dashboard which summarizes data from the trend
database, or an external analytics software package, the data will be
there when it’s needed.
To
summarize, the WebCTRL system is an analytics package. Its
user-friendly graphics, extensive trend support, intrinsic FDD alarm
capabilities and similar features provide the data visualization users
need to guide their decision making. Existing add-on programs enhance
this capability with graphic reports. ALC continues to innovate
for the future, with a focus on making data meaningful through industry
leading user interfaces. The research and development team is working
to bring even better intrinsic analytics to future releases of the
WebCTRL system and to enhance the WebCTRL systems support for external
analytics packages. Download the full ALC whitepaper covering
these topics here.
About the Author
Steve Tom, has more than 40 years of experience working with HVAC
systems. At Automated Logic he coordinated the training,
documentation, and technical support programs, and frequently works
with the R&D engineers on product requirements and usability.
Prior
to joining Automated Logic, Steve was an officer in the U.S. Air Force
where he worked on the design, construction, and operation of
facilities (including HVAC systems) around the world. He also
taught graduate level courses in HVAC Design and HVAC Controls at the
Air Force Institute of Technology.
footer
[an error occurred while processing this directive]
[Click Banner To Learn More]
[Home Page] [The
Automator] [About] [Subscribe
] [Contact
Us]