 EMAIL
INTERVIEW
– Ken Sinclair, Duncan
Wilcock
EMAIL
INTERVIEW
– Ken Sinclair, Duncan
Wilcock|
June 2018 |
[an error occurred while processing this directive] |
| |
EMAIL
INTERVIEW
– Ken Sinclair, Duncan
Wilcock
Duncan Wilcock, MBA, B.Eng., PUMA Team
Leader, Prism Engineering Ltd.
Duncan is the key contact at Prism for PUMA – Prism’s Utility
Monitoring & Analysis software and services. Operating at the
intersection of automation and expertise, PUMA is web-based software
and services that help organizations get a grip on their energy costs
by better monitoring and analyzing their utility use. Since
Duncan
started at Prism he has lead the software development of submetering
integration, live smart meters, and integration with Energy Star
Portfolio Manager.
| Articles |
| Interviews |
| Releases |
| New Products |
| Reviews |
| [an error occurred while processing this directive] |
| Editorial |
| Events |
| Sponsors |
| Site Search |
| Newsletters |
| [an error occurred while processing this directive] |
| Archives |
| Past Issues |
| Home |
| Editors |
| eDucation |
| [an error occurred while processing this directive] |
| Training |
| Links |
| Software |
| Subscribe |
| [an error occurred while processing this directive] |
Sinclair:
What value does Energy Management Software provide to
users?
Wilcock:
PUMA is highly effective, easy to use, energy
management software that is well supported by people who know
buildings.
Through service, we help you make sense of energy data. Weather
adjustments are reviewed by certified engineering staff - so they have
an added level of trustworthiness. For many clients that value is
to
have us input the data from all their energy sources – steam heat,
water, electricity, gas, and more. As much as it
surprises us that
in the 21st century, we need to capture data by hand – the reality is
data comes in many forms. We take on that complexity and provide
simple energy, GHG, and costs information at your
fingertips.
Weather changes a lot from year to year, and it dominates most building energy use. PUMA adjusts raw energy data for you month-to-month when and where the action is needed. If your energy use is not just influenced by weather but by other factors, we can use your other variables too.
PUMA helps you prove the value of your successes on previous projects with accurately calculated savings. This easily builds the business case for future projects and continues to demonstrate the value of your success into the future.
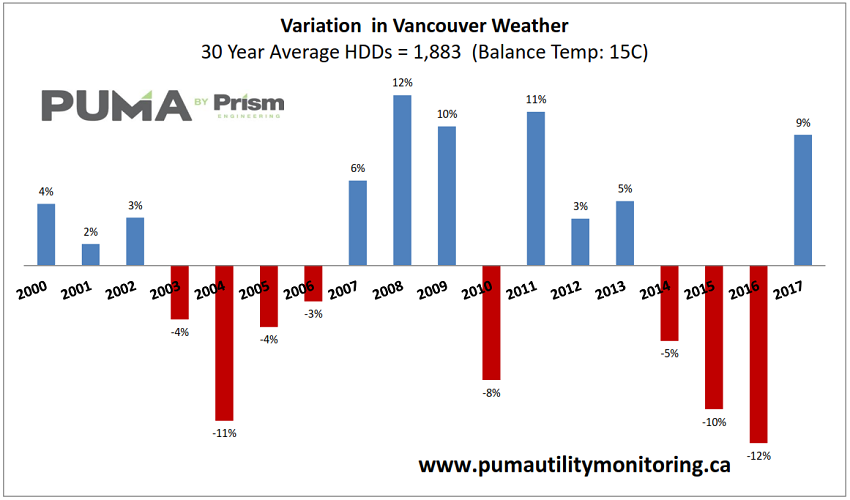
Figure 1: Variation in weather impact
on heating year-to-year
Sinclair:
What are the benefits of
multi-building owners?
Wilcock:
The more buildings you have, the more value you will find with
PUMA.
At a certain point all of your bills don’t fit on a kitchen table, and
by capturing your various utilities in one place, you can quickly make
comparisons of how similar sites performed in different years (or
months) and questions quickly arise. Those questions are the gold
that
leads to ongoing energy savings.
Many of our customer's favourite
feature is our monthly exception
report that identifies across hundreds of accounts which most deserve
your attention this month so that you know you are spending your
limited time where it is most effective.
Sinclair:
How are you different from other
competitors?
Wilcock:
PUMA is built by Engineers knowledgeable about buildings and used by
energy professionals to carry out various levels of energy
analysis.
It has been in use with our customers for nearly 25 years and undergoes
continuous improvement. Modernized for the web more than five
years
ago, the software is supported by Prism Engineering – BC’s leading
energy efficiency engineers that have pioneered energy management in
BC.
We focus on service, so we help you make
your energy data make
sense.
Rather than simply provide you with software and let you use it how you
like, we know what energy and utility data should look like and will
help you get the most out of it.
Another advantage is our certified staff that verifies energy models,
so you can have confidence in the savings figures your software returns
to you.
Sinclair:
I heard that you created some
innovative
portfolio-wide CUSUM graphs…tell me about that.
Wilcock:
We are big fans of Cumulative Savings graphs (CUSUM). CUSUM is so
great because it allows you to quickly visualize changes in
performance, after all the magic of weather adjusting is done.
This
allows the end user to focus on the bottom line of when problems may
have happened and by how much things are either improving or going
wrong.
We pioneered a technique for plotting electricity, gas, and other fuels together on the same chart, so that the scale of the savings from elec, gas, and other energies are immediately visible. If fuel switching occurs, it is immediately visible. We even do this with Costs, so that utility cost savings are visualized in their appropriate scale. Here is an example of one customer saving over $1million in energy costs in five years:
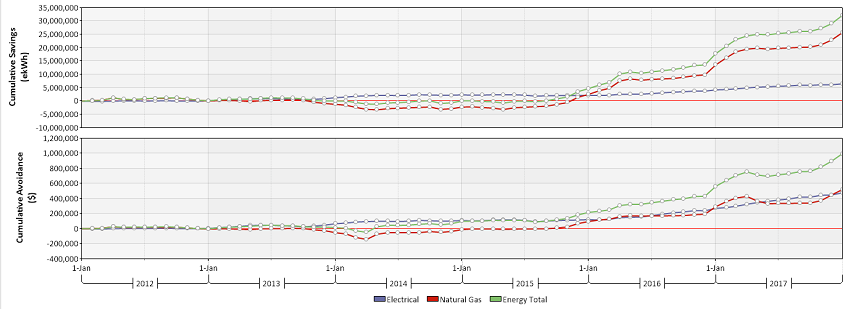
Figure 3: Cumulative Savings (CUSUM)
with electricity, gas, and total
energy on one chart.
Energy on top, Cost shown on the lower chart.
Furthermore, we allow users to select whether a positive slope (savings) or a negative slope (difference) is used to show savings.
[an error occurred while processing this directive]Sinclair:
How do you integrate with ENERGY
STAR Portfolio
Manager (ESPM) and what is the value proposition for ESPM users?
Wilcock:
We were one of the first organizations in Canada to build integration
with ESPM. We capture data from any source (Steam, water,
electricity,
gas, and more) and push it to ESPM, so you don’t have to keep two
datasets up to date.
We can also pull data from ESPM if you already have it there, and add
costs, demand, power factor, and other details in PUMA for a complete
dataset.
ESPM doesn’t have the same service component that can help you surface
and visualize key information when you are facing a
deadline. ESPM is
a good repository of data, and we are excited about ESPM - but when you
need deeper analysis such as CUSUM and ad-hoc graphical reporting, and
finding the meaning in your data, that’s where we really shine.
We have also built in a means to store the ESPM values as they change
over time.
Sinclair:
What are your current development
projects for the
software?
Wilcock:
We have been continuing to improve the software over the years, and
roll out those improvements to all our customers without a complex fee
structure. Our future development plans are focussed in three
main
directions:
Live Data
Monthly utility data can do a lot for organizations, but of course, the
future is in interval data. We are continuing to build out our
submetering offerings – we’re already tracking hundreds of submeters,
including live connections to BC Hydro Smart meters. So we are
exploring what other sources of live data we can connect to.
Reporting Enhancements
We are also adding to our reporting capabilities based on the feedback
of the over 50 organizations and over 15,000 accounts for which we
capture data. This will include better ways of visualizing live data
and continuing to improve our monthly reporting.
Further Integration with ESPM
As more utilities connect directly to ESPM for consumption data, this
represents a growing opportunity. We plan to continue to stay
ahead of
the curve with our ESPM integration for both push and pull of data.
[an error occurred while processing this directive]
[Click Banner To Learn More]
[Home Page] [The Automator] [About] [Subscribe ] [Contact Us]