March 2009
![]()
AutomatedBuildings.com
[an error occurred while processing this directive]
(Click Message to Learn More)
March 2009 |
[an error occurred while processing this directive] |
|
|
|
INTRODUCTION
The proper selection of airflow measurement devices is critical to the performance of today’s state-of-the-art HVAC control systems. As in most things, true comparisons of products, even when promotional literature is nearly identical or when used under similar conditions will not provide similar results. Many of the requirements and limitations of one measurement technology are often mistakenly thought to apply to every other, especially when the comparison involves two similar technologies.
|
|
|
|
|
|
|
|
|
|
|
|
|
|
|
|
|
|
|
|
|
[an error occurred while processing this directive] |
Accuracy and repeatability vary dramatically between measurement instruments and are most significantly influenced by: the inherent advantages / disadvantages of the basic technology, the manufacturer’s understanding of the technology employed, the quality of basic components used, consistency in the manufacturing process and the conditions found at the measurement / installation location. Nothing unexpected, had you taken a few seconds to think about it.
This article offers building designers and operators an overview of the functional and performance differences in currently available instrumentation technology used to improve the control of ventilation systems in buildings throughout the world.
The focus is on the two most popular technologies for permanently duct-mounted commercial measurement systems: Velocity Pressure devices (Pitot arrays, Pitot probes, Piezo rings, and other ΔP methods) and Thermal Dispersion devices (microprocessor-based instruments using some form of thermistor sensors). It intentionally excludes discussion of vortex shedding and RTD-type industrial instruments, which are generally applied in contaminated environments and/or high temperatures and are more expensive. They are not commonly used in typical commercial and most institutional buildings.
HISTORY
Historically, the merits of each brand of airflow instrumentation have had their roots in the inventiveness of their sales and marketing ploys; and why not? Because of variations in measurement techniques and the measurement equipment used, it is nearly impossible to validate the performance of velocity pressure-based, permanently mounted instruments under field conditions using field references as the comparison standard.
Furthermore, even under laboratory conditions, the performance differences among applied velocity pressure-based devices cannot be easily measured. Comparison of the published performance charts of ‘AMCA-certified’ products confirms this issue.
The promise of improved comfort control and energy savings of Variable Air Volume (VAV) air distribution designs was broken early during its development by the lack of instrumentation reliability at both the AHU and at the terminal units. Systems were simply too difficult to control and maintain. “Pressure independence” is essential to their function and consistently reliable instrumentation is essential to maximize their performance and realize the initial promise.
A better technology was necessary to allow designers and building operators to avoid the inherent principal limitations of pressure-based devices, including many sources of measurement error:
o instrument placement (resulting in variations in turbulence)
o measurement sampling (averaging) error
o field calibration reference with manual instruments,
o uncertainties due to manual measurement techniques
o measurement corrections required for zero drift, non-repeatability, non-linearity and temperature effects
o allowances required for air density changes,
o effect of improper installation
o effect of improper maintenance, and
o the cost-dominated component selection criteria (transducer range and FS accuracy).
Secondary instrument considerations included:
o installation time and setup costs
o setup requirements often overlooked by subcontracts
o lack of commissioning standards
o lack of cooperation among TAB and Controls subcontractors
o initial and recurring instrument calibration requirements
o continuous maintenance requirements, and
o low velocity (turndown) limitations.
THERMAL DISPERSION
Advanced thermal dispersion (TD) airflow measurement technology was introduced in 1985 and, within the scope of this article and in consideration of the previously mentioned limitations, is defined to include only microprocessor-based designs. Analog electronic instrument designs using thermistor sensors exhibit unacceptable response times and are unreliable, with major deficiencies in performance when operating over the expected normal equipment operating temperature range. Some microprocessor-based designs overcome these deficiencies, differentiated from all other types of thermal-based velocity measurement technologies.
TD technology is currently used by control systems in a wide range of office buildings, laboratories, healthcare and educational facilities to ensure healthy indoor air quality and economy of operation. Some TD manufacturers produce instruments that feature a combination of electronic components and some provide totally independent sensing elements. One TD manufacturer produces instruments that are factory calibrated to NIST-traceable velocity reference standards. When properly designed and applied with a sufficient density of sensing elements, the TD instrument can overcome (or minimize) the placement limitations and measurement uncertainties inherent in the use of velocity-pressure instruments.
[an error occurred while processing this directive] There are at least three U.S. manufacturers of TD air flow measurement instruments that meet some or all of those qualifications. Their products are markedly different in component specifications, functions and design features. Although they may appear to be similar in form and construction, a closer comparison of their design implementation, qualitative value, historical reliability, application limitations and verifiable performance yields surprising differences between them. Clearly, although their descriptions may be similar, instrument performance can be very different as well.
Early thermal dispersion arrays (prior to 1993) were significantly influenced by duct turbulence and placement conditions similar to velocity pressure arrays. Airflow measuring stations placed in locations close to duct disturbances often exhibited a “false high” reading. Since the technology determines airflow by relating the heat transfer rate from a warm body to the airstream, duct locations having excessive eddies and turbulence removed more heat from the sensor than when it was exposed to steady state factory wind-tunnel calibration, and hence, higher readings.
Enhancements to one TD sensor design in the early 1990’s placed the heated sensor in the turbulent wake created by the sharp leading edge of the sensor probe assembly. This “preconditioning” effect essentially made the airflow across the sensor more “turbulent” than the worst-case duct disturbance effect, therefore allowing for the condition to be created consistently. This design feature was further exploited during the calibration process. As a result, these particular thermal dispersion sensors are influenced far less by duct disturbances. The design is proven in full scale laboratory testing.* With advanced TD instruments, often, 0.75 to 1.5 simple equivalent duct diameters [(width + height)/2] is sufficient for accurate measurement when higher sensor density devices of this type are applied. Contrast this to the 3 duct diameter industry minimum standard that is required of other devices.
* Refer to Technical White Paper Airflow Measurement for HVAC Systems – Technology Comparison - Thermal Dispersion versus Pitot Tube Arrays at http://www.airflowmeasurement.com/Web_Pdfs/AirflowMeasurement_Comparison.pdf
In the spring of 2000, over 350 units of this design of TD devices were installed at the Advanced Measurement Lab complex at NIST in Gaithersburg, MD (http://aml.nist.gov/). These devices have performed without the necessity of field calibration and are reported to be functioning well, without a single reported sensor failure since installation over 7 years ago.
TD technology should not be confused or compared on any level with thermal anemometers, hot-wire devices or any other form of analog electronic velocity measurement. The term “Hot-wire anemometer” is typically used (incorrectly) as a generic term or all inclusive of a specific type of air flow measurement device. The negative impact in using a generic term implies to the reader that all products in the group possess similar properties and limitations. This association is advantageous for some manufacturers of lesser performing instruments who benefit from the superior characteristics of the better performing instruments. At the same time, this is clearly a disadvantage for the manufacturers of superior instruments who then suffer from the inferior characteristics of the lesser performing products of other manufacturers.
Hand-held thermal (single-point) instruments generally use unshielded thermistors, making them very sensitive to the direction and multiple vectors of airflow. They are typically analog devices, and as such, have a tendency to drift from zero. They usually require regular recalibration and ‘zeroing.’ They also tend to perform satisfactorily only when applied within a narrow temperature band, when used at favorable locations and at specific airflow angles.
On the other hand, at least one permanently-mounted TD product has a published operating range of -20 to +160 deg F and a design that limits the impact of rotational misalignment from improper installation. Tests performed by the manufacturer confirm the device’s immunity to improper installation (rotation of airflow angle). The test was conducted by monitoring the output signal while rotating the sensing device up to 30 deg from optimum (perpendicular to airflow). The results clearly demonstrate the TD device’s superior performance as compared to the two other significant competing technologies used in commercial HVAC. The results are depicted in the plot below.
Fig. 1
TD instruments are not totally immune to the operating conditions found in today’s buildings, although they are comparatively superior to Pitot arrays in almost every regard. TD performance is dependent upon the thermal transfer of energy (heat) from the sensing element to the measured airstream, as well as the precise determination of airstream temperature at the point of measurement. Conditions that could affect thermal transfer (insulating materials or liquid water) could also impact the ability of the instrument to function as designed. The TD manufacturer’s selection of the type and design of the sensing elements employed will ultimately impact all of the following elements:
• instrument cost,
• instrument MTBF (‘mean time between failures’ - reliability),
• instrument sensitivity to environmental changes,
• instrument stability over time and changing temperatures,
• the instrument’s ability to perform reliably without mechanical failure due to continuous temperature cycling between heating and cooling,
• the validity of the manufacturers’ factory calibration process,
• the need for or lack of interchangeability of instrument components or subsystems, and
• the environmental application limitations on product placement (e.g. ‘Do not mount at intake openings’ or ‘Must be mounted parallel to the duct’.
Prior to instrument selection, each of these elements and their implications for the success or failure of the system design must be considered by prospective designers and operators.
Although continuously soaked by condensation from coils or carryover from exterior louvers, water alone will not damage some TD devices that are designed to withstand it. When consideration is given during the instrument’s design, the impact of liquid water immersion on TD performance is temporary, with normal performance resuming as the sensor surface returns to ambient RH levels.
Insulating materials that could potentially bind to the tiny thermistor sensing elements are rarely an issue to a few thermistors designs. However, there are some uncommon conditions where specific materials combine with atomized grease or high humidity, and may require occasional light cleaning of the debris from the sensors. Typically, common dust and airborne particulate found in outside air and conditioned air ventilating systems is not capable of accumulating and producing an insulating value sufficient to materially impact the thermal transfer characteristics of the sensor. The impact on performance from common airborne dust and dirt is negligible to some bead-type glass encapsulated types.
PITOT-STATIC TUBES vs. VELOCITY PRESSURE ARRAYS
The term "Pitot-Tube" array is also used incorrectly as a generic term for “permanently installed instruments”. This tends to mislead uninformed readers that these devices posses the same properties, capabilities and limitations as the instrument referenced within the expression. As mentioned earlier, an association that elevates a technology’s characteristics is one reason that many manufacturers continue to use and take advantage of these terms.
The laboratory Pitot-static tube is a ‘primary’ instrument. This is an instrument having physical properties that have been scientifically proven to provide a predictable level of measurement performance, albeit with known application limitations. The Pitot array is not a primary instrument. The Pitot-static tube and the Pitot array share only the use of the velocity pressure (Pv) relationship in the determination of velocity and thereafter the calculation of air volume.
[an error occurred while processing this directive] However, a Pitot-static tube in the hands of a skilled testing and balancing technician that calculates average velocities through a Pitot-static tube traverse after selecting a suitable test location in the field is still a highly trusted method of obtaining field test information. They are important to the initial testing and balancing of many systems. This method is also the basis of many laboratory test standards (e.g. ANSI/AMCA 210 and ANSI/ASHRAE 41.2), but is susceptible to error creeping into the process due to the normal inconsistencies of human application.
There are approximately six noteworthy manufacturers in North America of various types of velocity pressure-based, duct-averaging products. There are at least twelve more manufacturers of VAV box pickups, fan inlet Piezo rings, flow balancing hoods, calibration and research devices, all based on these principles. All use the Pv relationship to calculate velocity and as a result share many of the same application and operational limitations.
As applied to commercial ventilating systems, this measurement technology has been around since the 1960’s, coincidental to the growing acceptance of VAV air distribution designs. Most Pitot array manufacturers also offer various ranges of P/E transducers and other electronic control devices that allow them to function with DDC control systems. The Pitot array ducted station is only one component of the measurement system that individually contributes to the total uncertainty of the measurement at the host controls input terminals. A pneumatic output is no longer a preferred interface method for building controls. The differential pressure must first be converted to an electronic signal, and then transmitted to the host controls or an intermediate device, either of which must then be programmed to make the analog output linear-to-flow.
Velocity Pressure arrays, Pitot arrays and Self-averaging arrays are all names for the same product species. It is a bifurcated device that separately equalizes total and static pressure within a length of partitioned tubing for differential measurements through small sampling holes positioned at a cross-sectional plane in the duct. A single differential pressure is measured between two compartments or equalizing manifolds. The raw output is assumed to be the "average" from numerous ports providing a non-linear differential pressure. This analog result must then be output electronically to a controller or display. It is made linear by an integrated transmitter, by a separate intermediate device (‘square-root extractor’) or by other method of calculation following transmission of the non-linear signal and its analog-to-digital (A/D) conversion within the host controller.
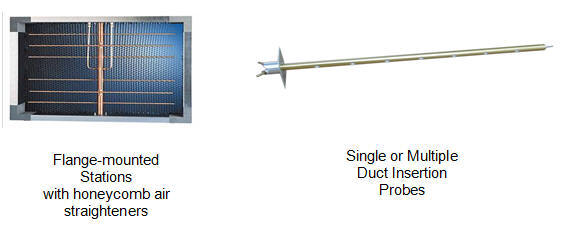
Fig. 2 Types of Ducted “Self-Averaging” Pitot Arrays
Professional TAB contractors measure the cross
sectional average velocity in a duct by recording individual readings at
specific locations on a plane perpendicular to airflow direction. Each Pitot
reading is determined by evaluating the equation V=4005*(∆P) 0.5, where ∆P is
expressed as inches of H2O. This generalized relationship uses a constant (4005)
that assumes standard conditions of altitude and temperature. The formula does
not account for changes in air density due to variation in air temperature and
barometric pressure (altitude). The readings are simply added together, divided
by the number of measurements and a final average airflow rate is determined.
Taking a high number of readings throughout the duct can help compensate for
changes in the velocity profile. It tends to reduce the uncertainty by
increasing the number of samples in the average; however, it increases the total
time required to complete the determination of all the data needed for averaging
(ISO3966).
Manufacturers of Pitot arrays promote high sampling ‘sensor’ densities (tiny holes in collector tubing) as a product feature and suggest that the sensor density of other devices using independent sensing elements is inadequate. The manufacturers associate the quantity of these ‘perforations’ in collector tubing with the required quantity of velocity measurements necessary to satisfy ISO 3966, ASHRAE Std. 111, AMCA 203, or any of the TAB Guideline requirements.. They are not equivalent and the comparison is physically and mathematically invalid.
Pitot arrays theoretically average the velocity profile; however, in practice, pressure equalization actually occurs along the length of a common collector tube, before the airflow rate is determined by a single sensing element (the pressure transducer). Thus, they have far less sensor density than any device with true multiple independent sensors. The output of a Pitot array can only represent the average reading across a duct that exhibits equal pressure distribution at all areas; certainly difficult under controlled laboratory conditions, and extraordinarily unlikely in actual field applications. Since Pitot arrays are so sensitive to , placement conditions, significant lengths of ductwork are required between disturbances to completely develop the necessary pressure profile across the array.
The differences between single-sensor and truly independent sensor technologies is easily demonstrated in theory, and confirmed in laboratory testing.
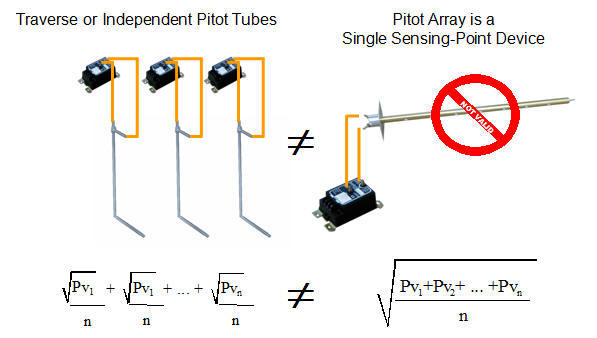
Fig. 3 Pitot Array Averaging Error
The use of a normal single point velocity pressure-to-velocity calculation assumes that there is no difference if Pv is averaged before v is determined at multiple points. Mathematically, a significant error is introduced to the result (8 – 18% of reading), when compared to any method of independent velocity measurements.
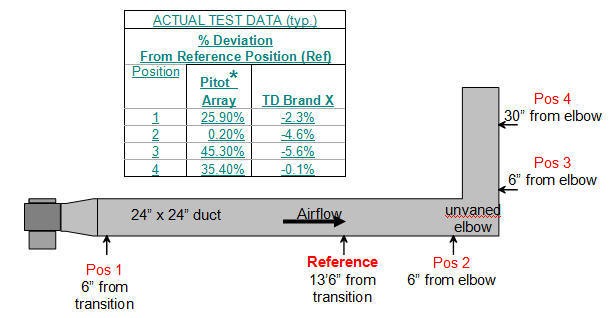
Fig. 4 Effects of Placement on Performance – Advantages of Independent Sensors
* Differential pressure measurements taken with
MKS Baratron pressure sensor, 0.05% of Reading accuracy to eliminate transducer
contributions to total measurement uncertainty and focus only on the placement
induced error effects on the instrument technology.
A published industry technical White Paper based on a technical discussion of
these technologies, and supported by test results (Fig. 3) compares the
influences on performance by upstream and downstream disturbances, as well as:
• The effect on individual sensor accuracy (effect of “turbulence”)
• The effect on overall sampling error of the array (effect of the velocity profile)
• The effect of placement of the sensor probe with respect to the velocity vector plane (rotation effect)
• The calibrated accuracy of the sensor(s)
• The calibrated accuracy of the transmitter/transducer
• Long-term stability
For details and explanation, refer to the technical White Paper* available at http://www.airflowmeasurement.com/Web_Pdfs/AirflowMeasurement_Comparison.pdf)
All Pitot arrays claim to provide an "accuracy of 2 percent". 2% ‘of what’, however, is not indicated. The terminology is at best misleading and implies that this level of measurement performance is actually achievable in the field, and without regard for differences in the application or in the uncertainty contributed by all of the other components needed in the Pv system to produce a linear duct average velocity signal to the controller. The implication is that the stated “accuracy of 2 percent” makes the device equal to all other products with a maximum uncertainty in measurement of “+/-2% of reading.”
This claim overstates the capability of Pitot array technology and oversells performance expectations. In ideal laboratory conditions, with professionally selected research equipment and test set up (as in AMCA Standard 610-06), Pitot arrays can produce a measurement uncertainty of +/-2% from a reference. In this case the reference is the AMCA lab, which contributes its own level of measurement precision and increases total uncertainty to the determination. Pitot arrays cannot consistently provide the claimed 2% level of combined total uncertainty under field conditions, against field references using unknown quality P/E conversion equipment and unknown linearization methods. Typically, Pitot array comparison is made only among other Pv devices, which lessens the contrast to the Pv reference standard used and makes the comparison more favorable to the particular device under test.
The accuracy of velocity pressure devices rely on the physical sampling of air through an array of many tiny sampling ports engineered to specific dimensions. Regular maintenance of these ports must be performed in order to prevent clogging of the orifices and to ensure proper performance of the measurement device. Most Pitot array suppliers offer the option of a pressurized purge system, intended to reduce the manual labor associated with regular cleaning of the sampling port orifices. The effectiveness of these purge systems has never been evaluated, however the cost of a separate instrument air system can be many times the cost of the measurement devices.
The accuracy of pressure based instruments with pressure cavities that have no apparent method of drainage is also concerning. Although output readings may appear to remain acceptable, the entire premise supporting the theory on averaging pressures is invalidated.
Combined moisture and airborne debris in the airstream of return fans will impact the performance potential and increase the maintenance needs of ANY instrument placed in such unsuitable locations. Pitot arrays physically sample the particulate laden air and are inherently susceptible to these conditions. Vigilant attention to, and regular cleaning of sensors is necessary to prevent failure of their ability to detect variations in velocity profiles. Particulate buildup continues to be the Achilles’ heel of Pitot array sensors.
In contrast, TD sensors feature a very large relative area of through-flow and an extremely small surface area for the individual sensing element. With their thermal conductivity intact, this allows TD sensors to continue to operate as designed in defiance of normal dust buildup, making them inherently immune to fouling from most common types of dirt. The binding effects of moisture combined with the insulating properties of some contaminants can degrade the thermal conductivity of individual thermal sensors and require only a light cleaning to restore their original performance.
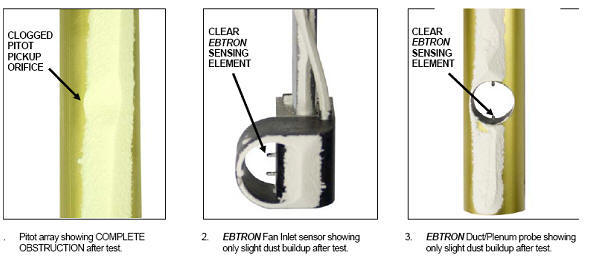
Fig. 5 Dust Loading Test Results – Pitot array compared to two TD sensor
configurations
In many cases, such as with fan tracking applications, repeatability, linearity and turndown are more important than absolute accuracy. Repeatability is the only measurement attribute important in the application of volumetric fan tracking control. Fan inlet conditions are unpredictable and therefore not conducive to situation based comparison studies. Conditions are extreme to the point of undesirability. It is the last possible airflow measurement placement some recommend. While it eliminates some design issues for the engineer, other troublesome installation issues arise (e.g. access to the reverse side of dual inlet fans in the field) as well as fan sound and fan performance issues that most Pv inlet installations generate.
At least one TD manufacturer has developed a fan inlet mounting arrangement that overcomes all of these issues and greatly reduces the potential impact to more sensitive plenum fan performance to less than 1% of rated flow. Furthermore, the design of this particular TD instrument provides consistently repeatable measurement in the most challenging airflow measurement applications.
The difficulty in determining the true baseline volumetric calculation and the resulting impact on control accuracy is compounded by the difficulty in determining the actual area of the plane in the inlet cone where the measurement device is to be installed. This is true for any airflow measurement technology applied at fan inlets. However, when the instrument produces measurements that are repeatable, it can be set up in the field to produce reliable and repeatable results. This is especially important as accessibility for maintenance or replacement is diminished, especially with many dual inlet fan designs and air handler configurations.
For additional reference materials on the topics of Indoor Air Quality, ventilation and pressurization control, etc. visit http://www.automatedbuildings.com/editors/ldamiano.htm.
CONCLUSIONS
Many types of velocity measurement products from numerous sources have been applied successfully and not-so-successfully over the past 40 years. The information here provided can be used to make better decisions on equipment selection, application and instrument placement. With this additional knowledge, you increase the probability of your next project operating more efficiently and reliably.
*Unedited source document for article in HPAC, March 2009
ABOUT THE AUTHOR
Len Damiano is Vice President - Sales and Marketing at EBTRON, Inc. where he has
been employed for a total of 17 years. He holds an M. B. A. with concentrations
in Management and Industrial Marketing from Rockhurst University in Kansas City;
and possesses a B. A. with a double major in Sociology and Economics from the
University of Missouri.
Len is a Member of ASHRAE since 1987. He is currently a Voting member of
6 Technical and Standing Special Projects Committees and Corresponding Member of
others:
TC 1.2 Instruments
SPC 41.2 Standard
Methods of Airflow Measurement
Contributor to the
2005 / 2009 Fundamentals Handbook, Ch. 14 on Instrumentation
TC 1.4 Control Theory and Applications
1353-TRP Control
accuracy and stability of VAV Terminal Unit controllers and sensors
SPC 195P Method of
Testing VAV Terminal Controllers for Rating
Contributor to the
2009 Fundamentals Handbook, Ch. 7 (15) on Controls
Contributor to the
2007 Applications Handbook, Ch. 46 on Controls
TC 1.12 Moisture Management in Buildings
TC 4.3 Ventilation and Infiltration (corresponding only)
SSPC 62.1
Ventilation for Acceptable IAQ, Main Committee and Education Subcommittee
He is a Member of AMCA (Air Movement and Control Association
International) for 25 years, Member of the U.S. Green Building Council
since 2003 and an Associate Member of the International Code Council.
Len is author of numerous technical articles and the co-author of ”CO2-Based
Demand Control Ventilation - Do Risks Outweigh Rewards?” and “Measurement
for the Control of Fresh Air Intake - an IAQ Prerequisite”, both published
in the ASHRAE Journal, October 2004 and January 1990 respectively.
[an error occurred while processing this directive]
[Click Banner To Learn More]
[Home Page] [The Automator] [About] [Subscribe ] [Contact Us]