|
November 2011
Article
AutomatedBuildings.com
|
[an error occurred while processing this directive]
(Click
Message to Learn More)
|
Educating and Engaging Occupants on Energy Efficiency
Get Your Occupants on Board
|
|
Energy management remains a hot topic. The spotlight on energy
efficiency continues to increase globally, according to the 2011 Energy
Efficiency Indicator1, a survey that has studied the interest in energy
efficiency over the past five years. The study tracked almost
4,000 global executives and building owners throughout North America,
who are responsible for energy management and investment decisions in
commercial and public-sector buildings. It was found that energy
cost savings and government incentives are the top reasons for pursuing
energy efficiency, and public image and the pursuit of green buildings
is another leading factor, an interest that doubled in just the last
year. Of those surveyed, an average of 8.9 percent have made
energy efficiency improvements in the last year, with educating
occupants being a frequent initiative, along with common building
improvements like lighting and HVAC changes.
To maintain an efficient building, it’s important that management
involve the occupants. Informing occupants of the initiatives a
facility has in place, and educating them on measures that they too can
follow to be more energy efficient can help ensure the building
operates efficiently. At QA Graphics, we have been involved
in the building controls industry since 2006 and anticipate that
tracking resource use will soon be commonplace in the commercial and
public sector as well as at home. New ways of helping individuals
to be aware of their energy usage continue to be made available, like
Google’s PowerMeter, which helps people track energy use at home, and a
new social energy app scheduled to be launched early next year by
Opower and Facebook, that will allow users to compare their home energy
usage with that of friends’ online.
 We work with a number of organizations to help raise energy
awareness and promote efficiency through the use of energy education
dashboards. Something we are working to clearly
define the difference between the common industry term, energy
dashboard, and an energy education dashboard. In our
experiences, we have found that energy dashboards are used for
summaries of important energy metrics within a facility. These
dashboards are very useful, but also very technical. To share this
information with occupants and the public, the information must be
easier to understand and have an educational focus.
We work with a number of organizations to help raise energy
awareness and promote efficiency through the use of energy education
dashboards. Something we are working to clearly
define the difference between the common industry term, energy
dashboard, and an energy education dashboard. In our
experiences, we have found that energy dashboards are used for
summaries of important energy metrics within a facility. These
dashboards are very useful, but also very technical. To share this
information with occupants and the public, the information must be
easier to understand and have an educational focus.
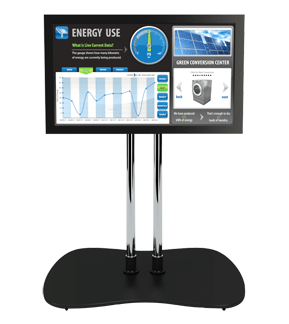
An energy education dashboard compliments an existing building
automation system. It’s an interactive application that
illustrates building performance in a simpler manner and provides
education about efficient resource use and the initiatives an
organization has in place. Typically utilized in a building
lobby or common area, such solutions are very social, engaging viewers
as they pass by. Energy education dashboards serve as a
positive marketing solution for organizations, allowing them to not
only share their sustainable initiatives with occupants and the
community, but educate on how everyone can help with energy efficiency.
This is something that is supported by a number of green building
certification programs; organizations commonly receive credit for
implementing such solutions.
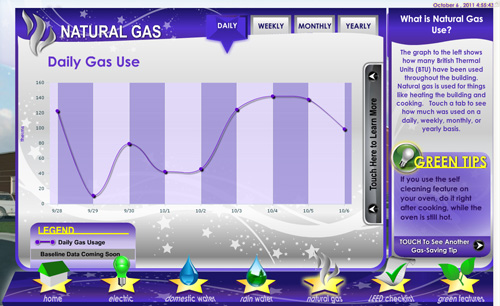
Occupants can learn about energy saving features in place, as well as
how they can help conserve resources. Any data being monitored
can be displayed to provide direct feedback on how the building is
operating. Commonly, a variety of other interactive features are
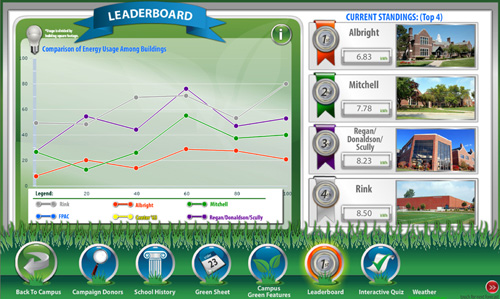
also used to engage occupants. For example, a leaderboard
can compare energy data demand among multiple buildings or floors
within a building, providing a social competition that encourages
occupants to make energy conscious decisions. Other features include
demonstrations of how building features actually work, LEED checklists
that explain what was done to achieve the green building certification,
quizzes that allow viewers to test their ‘green’ knowledge, and
conversions that make energy efficiency applicable to our daily lives,
like X kilowatt hours saved is equivalent to X loads of laundry dried,
or how many homes could be powered. Education like this provides
a creative way to address sustainability, especially for younger
audiences.
In our experience, energy education dashboards are highly used in the
education sector to create environmental awareness among the next
generation. An example of a school that we recently worked with
is Nichols School, a fifth through twelfth-grade school in Buffalo, New
York. Nichols has a comprehensive approach to promote campus
sustainability, and their energy education dashboard serves as another
means to encourage environmental awareness.
[an error occurred while processing this directive]
Displayed in the math and science building, students can view energy
demand for each of the six buildings on campus, along with information
about green features in place, educational demonstrations, an
interactive quiz, and a leaderboard that keeps students excited about
reviewing energy data. The leaderboard was used last Earth Day as part
of a campus-wide event, where for half the school day, everyone
on campus was encouraged to turn off lights, projectors, and anything
else they could do to lower electrical consumption. Then with the use
of their energy education dashboard, they reviewed the energy demand
among the six buildings and calculated the percentage drop from a base
value for each building. This was a creative and memorable way to
get the entire school involved, and the campus saw an average drop in
energy use of 14 percent.
Nichols also plans to use the energy education dashboard to compliment
the school’s curriculum plans. The building data
information is downloadable, so teachers can use the information in the
classroom. Faculty is excited to have authentic data because of
the relevancy it offers students; they can explore why buildings with
science and technology classes use more energy, consider the
distribution of different heating and cooling systems throughout the
buildings on campus, and speculate reasons for peak times and days for
usage. The live application of Nichol’s energy education
dashboard may be viewed at http://eeed.nicholsschool.org/eeed.
This is just one example of how an organization has used building
performance data to engage and educate occupants as part of an
organization’s overall energy efficiency initiatives. There
are countless ways to engage audiences of all ages, and QA Graphics has
found that educating through innovative and creative solutions is a
very memorable way to address energy efficiency. The hope is that by
showing occupants what’s going on in their building, they will be
motivated to make environmentally conscious decisions.
QA Graphics works with organizations all over North America providing
their solution, the Energy Efficiency Education Dashboard®, to help
educate about building efficiency. For more information, visit
www.qagraphics.com/eeed or come see us at the upcoming AHR EXPO in
Chicago (booth #3729).
References:
1 2011 Energy Efficiency Indicator: Global Results, June 2011,
Institute for Building Efficiency, an initiative of Johnson Controls,
Inc., in partnership with the International Facility Management
Association, and the Urban Land Institute.
footer
[an error occurred while processing this directive]
[Click Banner To Learn More]
[Home Page] [The
Automator] [About] [Subscribe
] [Contact
Us]