Building designers, owners, managers and tenants are now more than ever looking at technologies that can have a measurable and continuous cost reduction impact.

Dave Craven
Principal,
KC Rep Source LLC
|
November 2012 |
[an error occurred while processing this directive] |
| Shedding Some Light Building designers, owners, managers and tenants are now more than ever looking at technologies that can have a measurable and continuous cost reduction impact. |
Dave Craven Principal, KC Rep Source LLC |
| Articles |
| Interviews |
| Releases |
| New Products |
| Reviews |
| [an error occurred while processing this directive] |
| Editorial |
| Events |
| Sponsors |
| Site Search |
| Newsletters |
| [an error occurred while processing this directive] |
| Archives |
| Past Issues |
| Home |
| Editors |
| eDucation |
| [an error occurred while processing this directive] |
| Training |
| Links |
| Software |
| Subscribe |
| [an error occurred while processing this directive] |
Here we are in 2012, 133 years after Thomas Edison’s invention of the incandescent light bulb. Too bad Edison couldn’t get a glimpse of what the landscape looks like today with all of the variations of the basic device available to the public.
I think he would also be startled by the enormous nature and complexity
of the overall infrastructure we casually refer to as the “Grid” and
all of the tertiary data collection and control elements involved in
managing overall use. Estimates vary as to what elements of usage are
attributable to all forms of commercial lighting use in the U.S., in my
opinion the DOE numbers are as valid as any available.
http://www.eia.gov/consumption/commercial/index.cfm
But whatever that percentage is in the commercial sector it is the most visible even though it is not the largest use component. It still amazes me in this day and age to drive through a metropolitan area at night anywhere in the country and observe many buildings lit up like Christmas trees. I am sure that the average person has the same reaction. What the average person doesn’t see, unlike the readers of Automated Buildings, is the probability that in concert with the 250 kW worth of inadequately controlled lighting operating at 9:00 PM, there is a strong likelihood that there are 650 kW of central plant components in operation and another 150 kW of air handling equipment moving and treating who knows how much outside air into the building envelope.
The focal point being use or utilization. The most basic tenets of energy conservation are when there is no one in the space, turn it off, turn it down, set it back. Easier said than done, particularly when it comes to lighting. The reasons are many. Between all of the different forms of office space infrastructure including private offices, collaborative workspace, meeting rooms, touchdown areas, open plan workstations, the number of control schemas needed are considerable.
Another hurdle is the existing electrical infrastructure being limited to circuiting in place in existing facilities.
Between these items the most logical choice the end user can make is to retrofit along lighting technology lines, T12 fluorescent to T8, T8 to LED etc. The ROI calculus is relatively straight forward. If the use basis is 12 hours per day the savings and return rate are fairly straight forward.
Now for the monkey wrench. Let us consider the 12 hours of on time. What is the actual utilization basis of each physical space in the building? 80%? 70%? 62%?
Actually, it is continuously dynamic and completely dependent upon the
activity in the space. What may surprise the readers is that rarely is
the physical use percentage during occupied cycles greater than 60%,
and in fact closer to 40% in most commercial office space environments.
Sounds implausible, doesn’t it? I will be completely candid here; my
first reaction was skepticism as well.
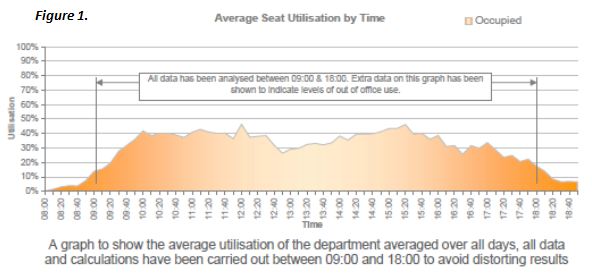
Now take a look at this utilization activity report, Figure 1., which
was generated by a commercially available service which has surveyed
over 100,000 positions in multiple Fortune 100 firms worldwide among
others, using a wireless technology supporting
occupancy/utilization measurement.
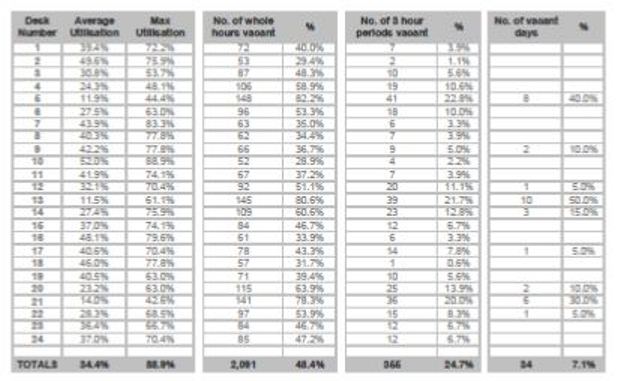
The actual information is collected and tabulated in near real time
giving accurate information on each seating position in the entire
facility, down to the desk level as shown in the sample report format
below, Figure 2. The actual survey of the entire facility was conducted
over a four week period encompassing 635 positions on multiple floors.
If you accept the physical findings then the question becomes how to
provide intelligent control applications to further reduce the energy
consumption of the lighting systems.
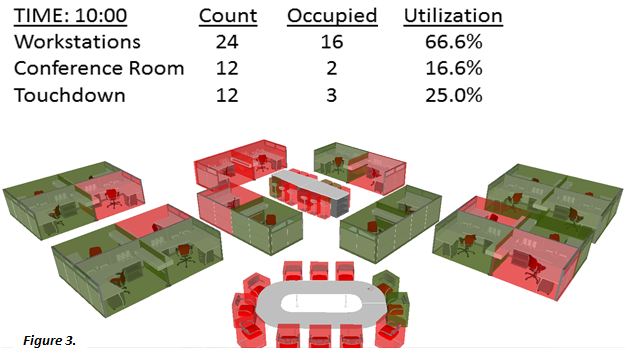
In the area represented above in Figure 3., the positions in red are unoccupied, those in green occupied. The most obvious target for lighting capacity control would be the task lighting at the individual workstations and depending upon higher level logic control and physical location, overhead lighting.
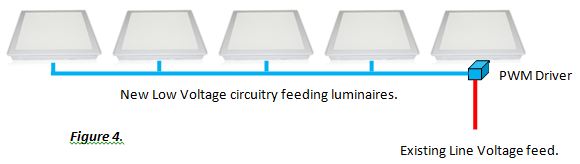
This becomes technically difficult and expensive when the lighting
infrastructure is line voltage fluorescent fixtures. It becomes far
more practical when the lighting infrastructure is LED and based upon
PWM (Pulse Width Modulation) controlled low voltage drivers, with four
to six luminaires per as shown below in Figure 4.
In Figure 5. below, a larger whole floor area where each position occupied is represented by a green icon. The initial reaction one would have is that this floor depicted below is highly utilized, and it is, except for 23% of the open plan workstations, whose occupants are most probably utilizing the meeting rooms on this floor. (Meeting Rooms bracketed in red.)
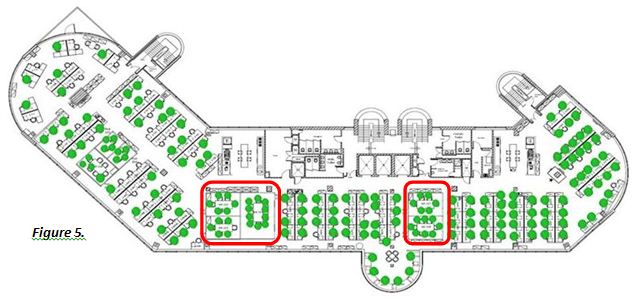
This particular facility is a major news organization office in London.
This snapshot was taken at 9:12 AM on a Monday morning. In fact the
wireless space utilization analysis system was installed at this
facility not on the basis of controlling lighting, or augmenting
control of HVAC systems but rather to gain an accurate understanding of
exactly how the overall infrastructure meets or does not meet the
physical requirements of the occupants and work flow. The overall costs
of fitting out a modern commercial office space with furniture and
related equipment in major metropolitan areas of the world is
staggering. Getting it right translates into effective capital
expenditure.
[an error occurred while processing this directive]
What having this form of technical infrastructure in place now presents
as an opportunity is the export of information to other building
systems, which may include lighting, BAS, security and maintenance
management systems.
What the space utilization sensors at each position may be populated with are temperature sensors so that in addition to providing the utilization data, a higher resolution temperature map of the space can be provided.
The system being described is offered by Abintra Consulting.
Information can be obtained on Abintra’s services and technology at the
following URL’s.
http://www.abintra-consulting.com/
http://tech.kcrepsource.com/architecture/abintra/
You may also check out an actual survey data compilation at the link
below. Sort by department on Friday’s, and note “Sales” utilization
rates after 12:00 PM.
http://89.105.105.220:8080/wisenet_demo/rdPage.aspx
What other facets of building operations can be improved upon or
augmented using technology that is at the core application designed and
integrated for a totally different set of purposes?
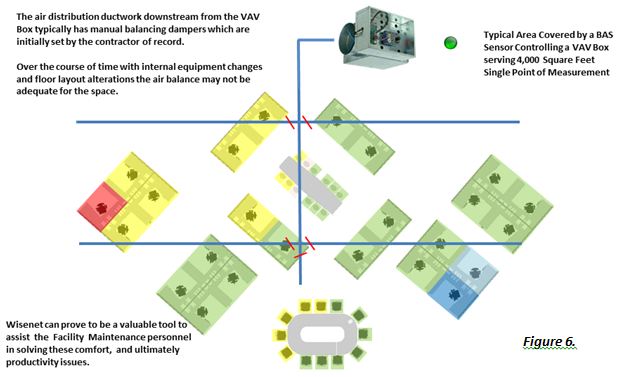
A side stream example is depicted in Figure 6 below. When the MEP
design firm sat down and laid out the overall Electro/Mechanical design
based around directed criteria they can usually account for the
inevitable alterations to the space within the design. But due to the
fact that there are so many items that can adversely affect
environmental control performance this is not always the case.
Security systems are another area that the integrated system may be able to play a role in. Despite modern security systems ability to integrate highly sophisticated levels of technology, particularly where high resolution video surveillance products are in play, cameras and their supporting infrastructure are expensive. Now consider the possibility and advantage of being able to view a single screen and know precisely where individual seat positions are occupied in the entire facility.
The case basis still remains lighting control at the center. The more probable long term technology is LED integrated with wireless sensing and control elements. System portability over the effective life span of the infrastructure is a major factor to be considered. The cost difference between LED and fluorescent continues to shrink. Building designers, owners, managers and tenants are now more than ever looking at technologies that can have a measurable and continuous cost reduction impact.
Look what you put in motion Tom!
About the Author
Dave has spent 39 years of his career in various organizations with primary involvement being Instrumentation, Automation, Controls, HVAC and Energy Conservation.
Direct industry experience in Building Automation, HVAC Manufacturing, Performance Contracting, and for the past nine years principal involvement has been in developing and manufacturing 802.15.4 Wireless technology and products.
Dave is a Principal in KC Rep Source LLC, based in The Woodlands, Texas. KC Rep Source is an OEM and Distribution channel for Wireless products manufactured by Everex Communications. Current product development is focusing on integration of LED lighting products with Wireless RF Mesh control. Trend Lighting Corporation based in Taiwan is the development partner.
Dave has previously contributed written content to Automated Buildings.
http://www.automatedbuildings.com/news/jul04/articles/andover/andover.htm
[an error occurred while processing this directive]
[Click Banner To Learn More]
[Home Page] [The Automator] [About] [Subscribe ] [Contact Us]