|
November 2013 |
[an error occurred while processing this directive] |
|
Report
Generation Requirements for (BAS) The world of report generation is broad and diverse with solutions that range from fundamental toolkits that require a greater level of integration and long term support, to more advanced and independent solutions.
|
Roy
Kok, VP of Sales and Marketing Ocean Data Systems makers of Dream Report |
| Articles |
| Interviews |
| Releases |
| New Products |
| Reviews |
| [an error occurred while processing this directive] |
| Editorial |
| Events |
| Sponsors |
| Site Search |
| Newsletters |
| [an error occurred while processing this directive] |
| Archives |
| Past Issues |
| Home |
| Editors |
| eDucation |
| [an error occurred while processing this directive] |
| Training |
| Links |
| Software |
| Subscribe |
| [an error occurred while processing this directive] |
Automation and
building enhancements can provide up to a 3-4X return on
investments, in terms of energy savings. A Deutsche Bank and
Rockefeller Foundation study found that up to $279 billion could be
invested in building efficiency retrofits in the U.S. and that such an
investment would yield up to $1 trillion in energy savings. That
is the carrot. But getting there requires an understanding of the
current state, and the ability to track changes over time, and the
ability to make positive improvements actionable, by those that have
the power. This latter point highlights the need for data
analysis down to a major asset, area of a building or the responsible
department. Submetering has been identified as a major
opportunity for improving energy use in our buildings, in a 2011 report
by NIST. The report is a product of the Buildings
Technology Research and Development Subcommittee of the National
Science and Technology Council (NSTC), a cabinet-level council that is
the principal means within the executive branch to coordinate science
and technology policy across the diverse entities that make up the
federal research and development enterprise.
The challenges in improving visibility and hence, the ultimate accountability, are twofold. First, the technology to measure to local levels for water use, electricity use or the use of other energies, correlated with seasonal changes, occupancy changes or business needs must be in place. The second challenge involves the analysis of data, and the generation of meaningful and actionable dashboards or reports. The raw data for all this is generally available, but often from disparate systems. These involve Building Automation Systems (BAS), Building Security Systems, and energy accounting data – rates and fees. These systems will have different communication protocols, different archival formats, etc. While each may have some ability to generate reports from its own sources, few solutions are able to integrate the broad spectrum of data sources.
Report generators come in many forms, and report generators are the ideal solution for distributing the information required for action, as opposed to pure dashboards that require users to proactively log-in and call up the information. Reports can be posted to a directory, uploaded to a portal, and emailed to those responsible for continuous improvement. The proactive delivery of data will deliver better results than a passive site requiring user activity. However, a solution that combines the best of both, information analysis and automated delivery, combined with a portal enabling ad-hoc review of data analytics would be the ideal solution.
Most
report generators, available from automation solution providers,
are designed to get their “Report Generator” checkbox. They
typically leverage technology the user is already familiar with, and
that moves most of the heavy lifting to a toolkit, rather than flexible
and preconfigured solution. Specifically, many solutions leverage
Microsoft Excel, combined with connectivity plugins for proprietary
data sources. These solutions can certainly deliver the analysis
functionality that users will need, but are often sacrificing the
benefits of a solution architecture that will deliver security,
scalability, connectivity across the enterprise and most of all – ease
of use. These items will all contribute to hindering progress
toward the ultimate goal, easy access to an analysis of data that will
drive action.
Reporting Features to Consider:
Connectivity – Building Automation System (BAS) reporting solutions may require several levels of capability, based on the type of facility. If it is a manufacturing facility, there are typically additional automation systems to and data stores to connect to. At the high end, there are corporate Historians that will require proprietary or standards based connectivity. On the standards side, these will typically be OPC HDA (Historic Data Access), ODBC (Open Database Connectivity) or OLE-DB.
At the lower end of the technology spectrum, connectivity might include access to primary elements, and the need to perform some intermediate data storage for analytics. In these cases, communications will require either proprietary interfaces to equipment, or the more common interfaces – MODBUS, BACnet or Echelon.
Other data stores will include relational databases, for security systems, accounting data and the such. These typically fall into the ODBC and OLE-DB categories.
Analysis –
This is an interesting differentiator between
solutions. More sophisticated offerings will deliver a set of
predefined tables, charts, graphs and the ability to perform ad-hoc
calculations. In the past, products could be differentiated by
the power of their toolkit. Today, engineers don’t have the time
for learning to fish. They need to be provided with the
fish. Products need to deliver the functions required in a way
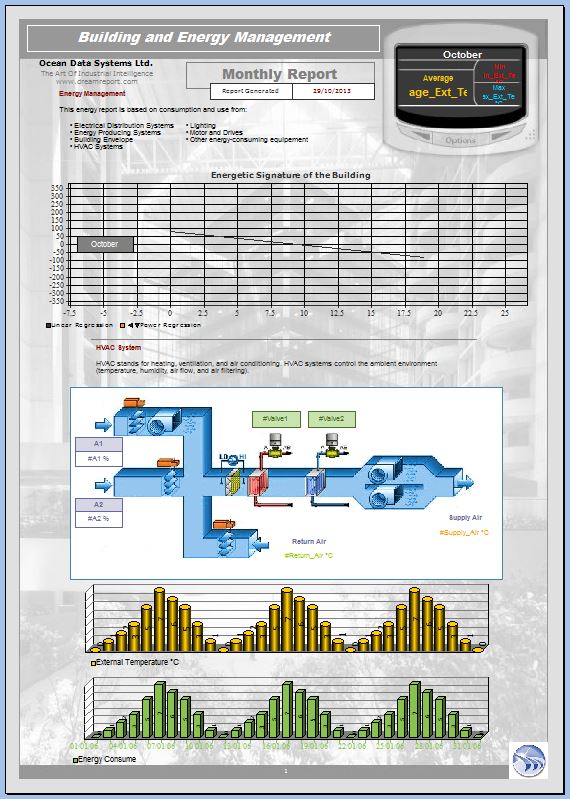
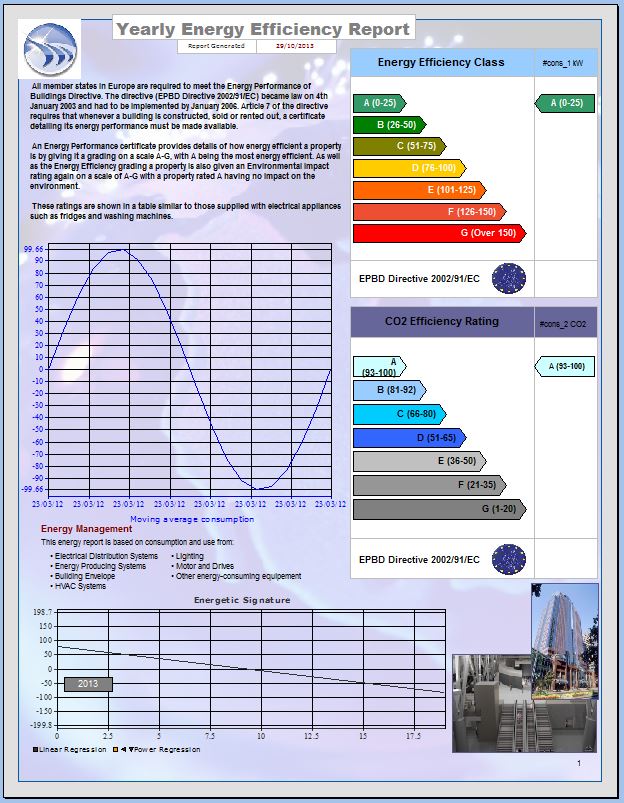
that is easy and foolproof to implement. For example, Report
objects can calculate and score your Energy Efficiency, Calculate the
CO2 Rating, and the Energy Signature. In toolkits, configuring
the fundamentals of calculations will take days of effort and will
require both debugging and documentation. In a report generator
with “Purpose Built” functionality, is comes down to simple
configuration. Of course, if your goal is to place data into an
Excel Spreadsheet, they can typically offer that functionality as well.
Presentation and Distribution – This is a crucial component of a solution for continuous improvement. As stated earlier, placing data into a spreadsheet and posting it for others to review, is not proactive enough to drive continuous improvement. Once a report is formatted, it should be delivered to one or more printers. Ideally, is one printer is unavailable, a backup should be specified. Hardcopies can be posted publically or within departments to create peer pressure. Reports should be archived for future recall, but also automatically distributed to those with accountability – department heads, facility managers and the like. And, ideally the report solution should offer web access, delivering a secure portal for both recalling reports (with proper access rights), and generate new report instances as necessary for drilldown analysis.
[an error occurred while processing this directive] Other considerations: While the items above make up the Must-Haves, there are a great many Nice-To-Haves which will make a reporting environment that much more capable.
Conclusion
The
world of report generation is broad and diverse with
solutions that range from fundamental toolkits that require a greater
level of integration and long term support, to more advanced and
independent solutions, from vendors that are focused purely on
reporting technology. In the world of industry and automation,
repurposing standard business applications, such as Microsoft Reporting
Services, or business reporting solutions such as Crystal Reports, will
typically prove to be high in maintenance and will require a
specialized skillset, in addition to the challenges of connecting with
proprietary real-time or historian data sources. The focus should
be on low total cost of ownership, and ease of use, to maximize your
opportunity for continuous improvement.
About the Author
Roy Kok - VP of Sales and Marketing for Ocean Data Systems, makers of Dream Report
Ocean
Data Systems, headquartered in Lyon France, offers Dream Report, the
leading technology for automated analytics and report generation for
industry. As their VP of Sales and Marketing, I am responsible for
defining and implementing their global go-to-market strategy,
marketing, and the development of OEM and Channel Sales. Prior to
ODS, I worked with ARC Advisory Group, the leading research and
advisory firm for industry and infrastructure. As VP of Marketing, I
was responsible for marketing all ARC products and services globally,
and, working with sales, to develop new markets driving ARC's
success. Both of these jobs gave me the opportunity to dig deep
into vertical markets, one of the more significant ones being Building
Automation Systems (BAS), combined with technologies for Smart Cities,
Smart Grid and Energy Management. Contact me at
Roy.Kok@DreamReport.net
[an error occurred while processing this directive]
[Click Banner To Learn More]
[Home Page] [The Automator] [About] [Subscribe ] [Contact Us]