After application of continuous commissioning, technicians can focus on problems with the highest energy savings potential or probability of comfort violation.

Jan Široký
Research Team Leader
Energocentrum Plus
|
October 2016 |
[an error occurred while processing this directive] |
| Automated Continuous Commissioning After application of continuous commissioning, technicians can focus on problems with the highest energy savings potential or probability of comfort violation. |
 Jan Široký Research Team Leader Energocentrum Plus |
| Articles |
| Interviews |
| Releases |
| New Products |
| Reviews |
| [an error occurred while processing this directive] |
| Editorial |
| Events |
| Sponsors |
| Site Search |
| Newsletters |
| [an error occurred while processing this directive] |
| Archives |
| Past Issues |
| Home |
| Editors |
| eDucation |
| [an error occurred while processing this directive] |
| Training |
| Links |
| Software |
| Subscribe |
| [an error occurred while processing this directive] |
Introduction
Nowadays heating, ventilation and air conditioning (HVAC) systems do
produce enormous amount of data. These data are stored in building
management systems (BMS) ready for exploitation. However, in practice,
these data are not always utilized. The operator or local technician
usually does not have enough time to analyze all data. But what would
take hours to human operator can be done in seconds by a computer. The
problem is how computer can analyze data similarly to a skilled
technician. During the recent year, there was a shift from a simple
alarm notification to more advanced algorithms. One can find different
names for these emerging tools (e.g. energy intelligence software,
operational diagnostics, monitoring-based commissioning). In this
article we will use a term continuous commissioning. The main goal of
the article is to present results of application of continuous
commissioning in practice.
We will describe application of continuous commissioning to a customer
in the European Union. The customer has 150 mostly office buildings
connected to cloud based SCADA system Mervis ( https://mervis.info ).
More than 10 000 000 unique value records (e.g. temperature, valve
setpoint, energy consumption,...) are stored in database each day.
Apart from common SCADA functions (schemas, alarms, trends, messaging
…) Mervis offers analytical tools for everyday use. But all these bells
and whistles are almost useless once you have to work with tens of
thousands variables and any regular evaluation and analysis of the
historical data becomes a nightmare. That is a moment when the advanced
analytical methods of continuous commissioning proves the most valuable.
Before application of continuous commissioning, technicians were
dealing with the most urgent HVAC problems. Usually without
consideration of severity of possible impact. After application of
continuous commissioning, technicians can focus on problems with the
highest energy savings potential or probability of comfort violation.
Thanks to application of continuous commissioning significant energy
savings were achieved.
Technical solution will be described in the next chapter, followed by
the brief description of the used methods. Selected examples and
results summary are presented in the last section.
Technical solution
At the core of the continuous commissioning process
described in this article is Mervis - cloud service for complex
supervision of building and other technologies. Its foremost function
is to integrate different control and building management systems that
have been installed in above mentioned more than 150 buildings over the
last 20 years.
Technologies by Siemens, Johnson Controls, Daikin, Landys&Gyr,
Schneider, Buderus, Honeywell, LG, Saia, Sauter and many others were
integrated. The measured data are securely communicated over the
internet.
The basic rule is that all communicated variables (tags, data points)
are logged into the highly optimized database every three minutes but
the system allows for any sampling period starting from less than one
second. Even the least important variable can play significant role in
later data analysis.

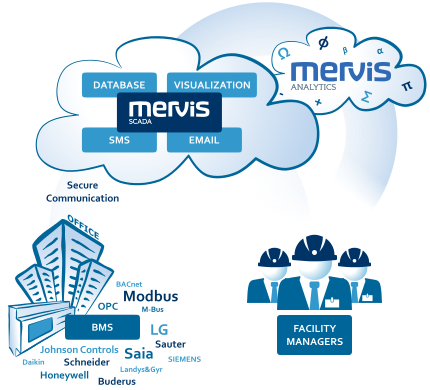
Simplified topology of cloud based Mervis services.
Once the data are collected and available online - the facility managers can do their regular work of monitoring the building technologies. More importantly they receive a complex report derived from the historical data every week. The report highlights the most important violations of comfort, energy efficient regimes etc. but allows for deeper analysis of the data directly in Mervis cloud system using direct links to particular measured values stored in the cloud. Methods that are used for data analysis are briefly introduced in the next section.
Methods used
We are focused on methods that can be simply applied without time
consuming configuration and tuning. Except of data tagging, no special
data preparation is needed. All preprocessing, analysis and avoidable
cost calculation is done automatically, without any user input. Thanks
to this fact reports can be generated regularly on daily, weekly or
monthly basis. The goal is to process raw HVAC data and prepare summary
information for an expert that can validate the results and perform an
action if needed.
The following analysis can be performed:
Each analysis uses different algorithms, from simple
rules (air
handling units) and basic statistical characteristics to sophisticated
methods such as neural networks (detection of non-standard profiles)
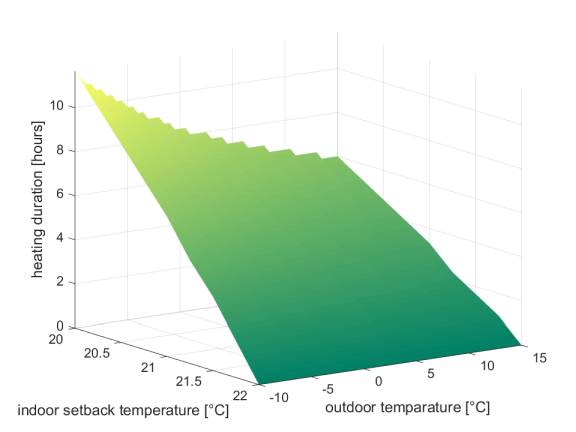
and mathematical modeling (heating system setback). Example of setback
analysis is depicted in the figure below.
Crucial part of the system is estimation of avoidable cost. If
possible, impact on energy consumption is estimated. The goal is to be
able to compare detected incidents in terms of avoidable cost, not to
provide a rigorous calculation of avoidable cost for each particular
incident.

Example of a heating
system setback
analysis. The chart depicts an
output of dynamical model simulation. The model is based on a real
building data. The green-yellow surface indicates time needed for
heating a building to 22 °C for different outdoor temperatures and
setback temperatures. For example, it will take more than 11 hours to
heat up the building from 20 to 22 °C when outside temperature is -10
°C.
Case study - results
As mentioned above, the described approach was applied to a building
portfolio of a customer in the European Union. The portfolio consists
of office buildings with a predefined regime (opening hours) and
similar usage patterns. Detailed knowledge of building regime (imported
from computer aided facility management systems) was crucial for the
analysis.
Electrical energy consumption outside office hours was identified as
the lowest hanging fruit. Complex evaluation of electrical energy
consumption with respect to building regime was performed. Ten
buildings with the highest saving potential were selected for a
detailed on-site investigation. The most common problem was wrong setup
of air handling unit time program. This was fixed by a simple
reconfiguration of building management system (no investment needed).
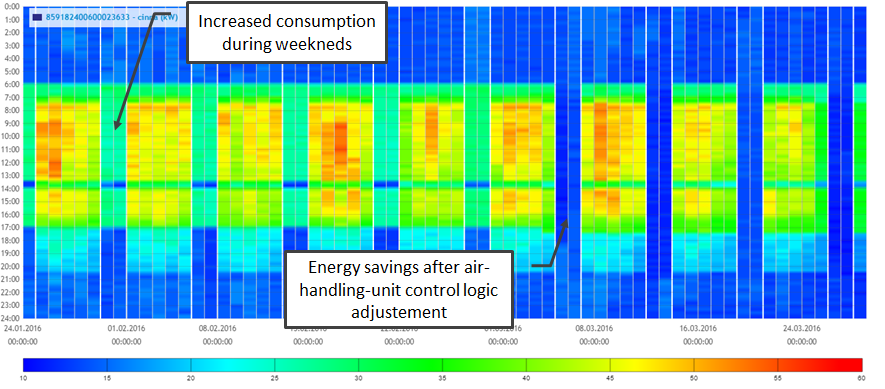
Outcome of such reconfiguration is depicted in the figure bellow. The
second common problem was lighting. In some cases lighting was turned
on outside office hours without any reason. In one case, we found an
oversized UPS. The UPS not removed after major reduction of IT in the
building. The overall savings achieved on ten selected buildings are $
20,000 per year with total investment lower than $ 4,000.

Carpet chart of
electrical energy usage. Weekly regime can be
recognized with significant reduction of weekend electrical energy
consumption after air-handling-unit regime adjustment.
This summer we had focused on unnecessary mechanical cooling outside
office hours. Again, we had selected ten worst performing buildings.
On-site investigation confirmed that the reason of suspicious
electrical energy consumption is cooling outside office hours.
Integration of autonomous cooling units into a monitoring and control
system was needed. Required payback three years was not satisfied in
most cases due to installation costs.
Application of continuous commissioning provided significant benefits
to a customer. We had performed evaluation of energy consumption of the
buildings before and after application of continuous commissioning. In
total, there was 9 % reduction of energy use after application of
continuous commissioning. Major advantage of continuous commissioning
is in long-term cooperation. It ensures that energy savings actions are
not ruined due to an inappropriate action (e.g. switch to manual regime
by a local technician). From this perspective, the customer is saving
several hundred thousand dollars each year.
About the Author
Jan Široký is leader of research team of Energocentrum
Plus company. Jan has gained his Ph.D. at the University of West
Bohemia, Department of Cybernetics. During his studies he
undertook an internship at ETH Zurich. The main activity of
Energocentrum is operation and servicing of energy equipment,
technological equipment of buildings and measurement and regulation. Energocentrum has its own research and development
department. This team develops software products for measurement and
control (e.g. cloud based SCADA system Mervis - https://mervis.info ).
Research team is focused on advanced control and monitoring algorithms
for buildings.
[an error occurred while processing this directive]
[Click Banner To Learn More]
[Home Page] [The Automator] [About] [Subscribe ] [Contact Us]