|
September 2017 |
[an error occurred while processing this directive] |
| Beyond Demand Response Intelligent Load Control for Dynamic Load Shaping Building Loads |
Srinivas Katipamula, & George Hernandez, Pacific Northwest National Laboratory |
| Articles |
| Interviews |
| Releases |
| New Products |
| Reviews |
| [an error occurred while processing this directive] |
| Editorial |
| Events |
| Sponsors |
| Site Search |
| Newsletters |
| [an error occurred while processing this directive] |
| Archives |
| Past Issues |
| Home |
| Editors |
| eDucation |
| [an error occurred while processing this directive] |
| Training |
| Links |
| Software |
| Subscribe |
| [an error occurred while processing this directive] |
What does the next
generation of demand response look like? Will technology advances,
ubiquitous use of distributed sensing, control and cyber-secure
platforms combined with low-cost communication infrastructure lead to
autonomous and intelligent building controls? Will this lead to
the widespread integration of buildings with the grid, leading to both
benefits to the consumers and the grid operators? The authors of
this article believe it will and that the technologies and platforms
that appear on the pages of Automated Buildings every month ( VOLTTRON™,
wireless communication, advanced controls) are the seeds for the next
generation of demand response.
Why do we need next generation of
demand response technologies?
In the U.S., buildings consume over 75% of the electricity. A
significant portion of the new electricity generation is in the form of
distributed renewables, which is variable and not dispatchable.
If the variable generation becomes a significant fraction of the total
system supply, it could potentially impact the reliability of the
grid. Distributed thermal and battery storage can mitigate some
of the imbalance between supply and demand caused by variable
generation assets. However, business-as-usual manual and
semi-automated processes will not scale and will not be
cost-effective. We need fully automated intelligent control
algorithms that can make autonomous decisions based on user
preferences, and we also need transactional platforms that can be
deployed on low-cost distributed computing platforms.
How is demand response deployed in
buildings now?
The concept of demand response (DR) has been with us for a long time
now, over 4 decades. Early DR deployments were mostly direct load
control, which is still practiced by some utilities today. Control
companies have developed semi-automated DR strategies, such as demand
limiting and duty cycling. The duty-cycling control strategy has
been traditionally used to manage peak demand by controlling the ratio
of the on-period to the total cycle time of rooftop units (RTUs) or
air-handling units (AHUs). Although duty-cycling provides relief
from electric demand, it does not have the ability to dynamically
prioritize the RTUs to be curtailed to manage peak electricity
consumption. In this approach, it is generally difficult to identify
the RTUs that can be curtailed without affecting zone comfort, and
indiscriminate curtailment of RTUs can lead to comfort issues by
negatively affecting the zone temperature and humidity conditions.
Therefore, a load control strategy is needed that anticipates the
future effects of thermal comfort and peak load relief based on current
conditions and past historical data.
What is beyond DR?
We need a process that dynamically prioritizes the available loads for
curtailment based on quantitative (deviation of zone conditions from
set point) and qualitative ( a type of zone: kitchen, corner office,
director’s office, etc.) rules set by the building operators. A
PNNL-developed technology, Intelligent Load Control (ILC), offers a
solution for achieving this balance (Kim et al. 2016, Kim and
Katipamula 2017). ILC is an algorithm, or a set of actions, deployed
via VOLTTRON™, a software platform, to a building’s
control system. The ILC technology can automatically adjust building
energy use by coordinating heating and cooling, lights and other
building functions while maintaining occupant comfort. In addition to
bringing flexibility and responsiveness to building energy consumption,
ILC benefits the grid by turning buildings into resources that help
balance supply and demand—which could help address some of the
challenges of adding intermittent resources such as the wind and solar
power to the energy supply mix.
ILC employs the analytic hierarchy process (AHP)—a method for
prioritizing actions to achieve the best results. For example, AHP
strategies can help determine whether shutting down or turning on heat
pumps in a certain sequence will achieve optimum energy reductions.
What are ILC capabilities?
Use case 1,
Managing Monthly Peak Demand: When demand for electricity rises
across the grid, so do costs. ILC can manage building devices in a way
that reduces more expensive peak power use periods. In the
traditional utility rate structure, many utilities charge not only for
the energy (kWh) consumed but also for the peak power (kW)
consumed. The peak is generally calculated as a rolling average
over any 15-minute or 30-minute period during a billing period
(typically 30 days). To manage the building peak under this
scenario, the building peak consumption over the 30-day billing period
has to be forecast. PNNL has developed an agent that will
forecast power using historical energy consumption by the building and
weather forecasts into the future. Next, a peak demand target (e.g.,
85% of forecasted peak) is selected. Using this approach, ILC can
control the operation of multiple controllable loads (e.g., heat pumps
serving offices and other work spaces or dimmable lighting loads). ILC
has been validated on several real buildings (see Figure 1 and Figure 2
below for sample results). Results had shown that when energy
consumption peaked at different times—such as first thing in the
morning while the building was being readied for the workday—ILC
quickly prioritized operation of heat pumps, shutting down some units
while running others, and returning the building to normal operations
when the peak demand period passed. The approach successfully reduced
demand to meet an established limit, which benefits power grid
operations, and no loss of service levels was reported.
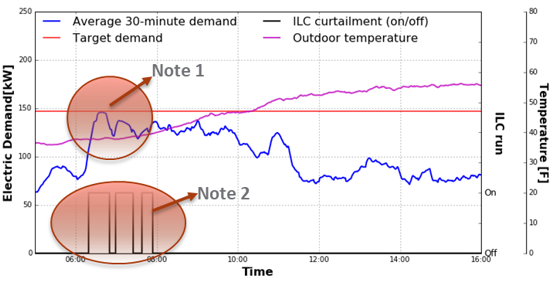
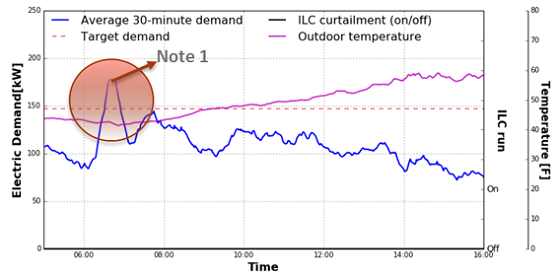
Figure 1: The top graph shows the operation of
the building without ILC
controlling the devices during heating season. Note 1: Peak demand for
this day is 175 kW, which was set at around 7 a.m. Note that the rest
of the day the demand never exceeded 145 kW. Also, note that the
duration of the peak demand was less than 15 minutes.
The bottom graph shows the same building with a target peak of 145 kW.
Note 1: Peak demand for this day never exceeds the target of 150 kW,
which was set at around 7 a.m. Note 2: Some end-use loads were turned
off to manage the load shape. If ILC were operational the previous day,
the building could have avoided approximately $125 of peak charges at
$5/kW or $500 at $20/kW.
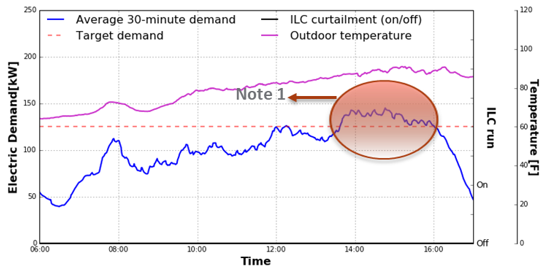
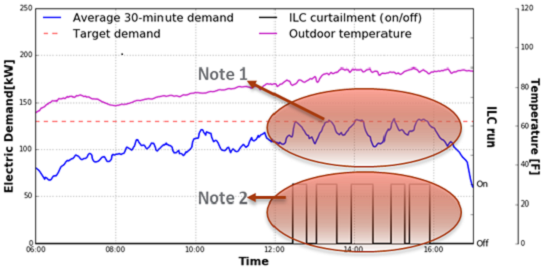
Figure 2: The top graph shows the operation of
the building without ILC controlling the devices during the cooling
season. Note 1: Peak demand for this day is 145 kW, which occurred
between 2 p.m. and 4 p.m. Also, note that the peak demand occurred for
significantly longer duration than originally anticipated.
The bottom graph shows the same building with a target peak of 135 kW.
Note 1: Peak demand for this day never exceeds the target of 135 kW,
which was set several times between 12:30 p.m. and 4 p.m. Note 2: Some
loads were turned off to manage the load shape. If ILC were operational
the previous day, the building could have avoided approximately $50 of
peak charges at $5/kW or $200 at $20/kW.
Use Case 2,
Supporting Capacity Bidding: Capacity bidding is a method
in which buildings agree to use less energy over certain periods,
providing relief to the power grid at times when electricity demand is
high. Under this approach, building management would reach a monthly
agreement on a certain amount of capacity, or “relief” the building can
give up, if requested to do so by the grid. The capacity amount can be
constant or cover specific blocks of time. In return, electricity
suppliers would provide incentives for the relief. ILC has been
tested and validated to support capacity bidding programs, and the
results are represented in the chart below (Figure 3). The red line
denotes the temperature adjusted baseline or the amount of power that
would be used by the building if nothing changes. The green line is the
capacity bidding target, and the blue is actual usage. Once the call
comes from the grid for relief, ILC automatically begins coordinating
device operation to achieve consumption levels below the red line—while
concurrently ensuring building safety and comfort levels. In testing,
ILC readily achieved objectives, reducing electricity use for the
correct time intervals. The entire process is fully automated,
including generation of baseline that is used to quantify the amount of
relief the building has provided (Figure 3). In addition, the
building owners/operators can see how well the building is actually
performing in real time. Finally, the measurement and
verification (M&V) process are also fully automated. As soon
as the event ends, the M&V report is automatically generated and
can be emailed to relevant parties.
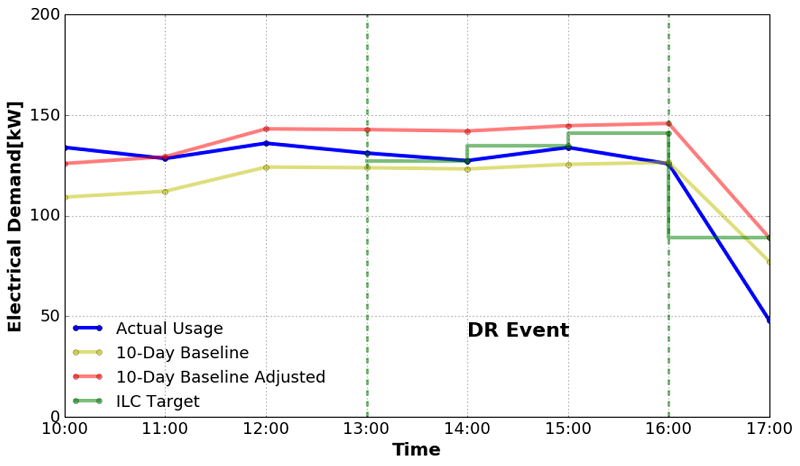
Figure 3: Shows the results of testing the
capacity bidding approach on
a commercial building. The light green line is the 10-day
baseline, the red line is the 10-day temperature-adjusted baseline, the
dark green line is the target based on the capacity relief the building
was going to provide, and the blue line is the actual consumption
during the event. Note that the actual consumption (blue line)
was mostly below the target value (green line) during the event.
Use Case 3,
Supporting Transactive Control and Coordination: ILC has
also demonstrated its ability to support the transactive control
concept, which in the future is expected to revolutionize operation of
the nation’s energy system (Corbin et al. 2016, Hao et al. 2017).
Transactive control enables energy-related devices to continuously
exchange electricity consumption and price information with suppliers
and negotiate and respond to that information to optimize energy use in
real time.
Under ILC, a price-capacity curve is established for individual
buildings. The curve represents how much energy a building is willing
to use based on the price at a given time, and is communicated and
proposed to the power market (Figure 3). Once the market accepts, ILC
begins managing devices to the capacity limit that corresponds to the
cleared price, while maintaining safety and comfort. If the energy is
low, the building can buy more power and perhaps perform tasks in
advance, such as pre-cooling. It’s envisioned the transactions between
buildings and the power market will occur in short time intervals
(e.g., every 5 minutes), enabling improved grid planning, flexibility,
and efficiency.
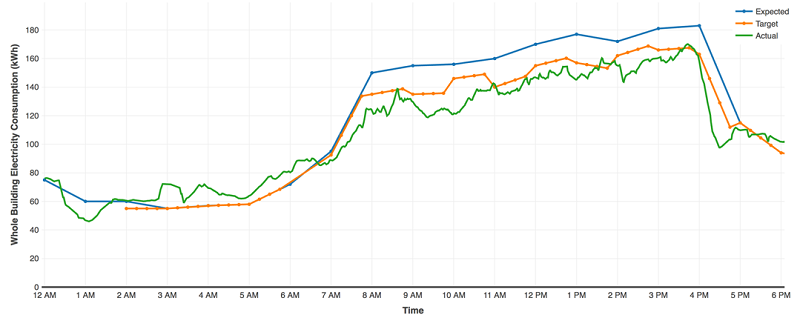
Figure 3: The graph shows expected building
consumption (blue), the
target consumption (price-based), and the actual (green). Note that the
green line stays below the orange for most of the day.
How is ILC deployed in the field?
The ILC algorithm is deployed from VOLTTRON, an open-source distributed
control and sensing software platform also developed at PNNL
(Katipamula et al. 2016a, 2016b, 2016c). VOLTTRON provides an
environment for applications, or “agents,” like ILC and serves as a
single point of contact for interfacing with devices (rooftop units,
lighting, other building loads and systems, meters, etc.). VOLTTRON’s
ability to manage data, devices, and decision-making has provided new
options for coordinating the integration of buildings, the grid and
clean energy sources.
[an error occurred while processing this directive]
When will the path to the beyond demand response take shape?
With the availability of the open-source distributed sensing, control
and cyber-secure platforms like VOLTTRON and agents like intelligent
load control that are deployed on it, the future is not far away.
The U.S. Department of Energy is engaged in a number of efforts to
validate these technologies in both individual buildings and also on a
campus scale. Several utilities have also shown interest to go beyond
the traditional DR to support grid reliability and low cost to their
customers. Coupled with these developments and the availability
of low-cost distributed computer platforms (e.g., Raspberry Pi, Beagle
Bone, Intel NUC, etc.) and communications will make beyond DR a reality
sooner rather than later!
_____________________________________
References:
Corbin CD, A Makhmalbaf, G Liu, S Huang, VV Mendon, M Zhao, S
Somasundaram, H Ngo, and S Katipamula. 2016. “Transactive Control of
Commercial Building HVAC Systems.” PNNL-26083, Pacific Northwest
National Laboratory, Richland, WA.
Hao H, DC Charles, K Kalsi, and RG Pratt. 2017. "Transactive Control of
Commercial Buildings for Demand Response," IEEE Transactions on Power
Systems, 32(1), 774–783, January 2017
Katipamula S, J. Haack, G. Hernandez, B. Akyol and J. Hagerman. 2016a.
"VOLTTRON: An Open-Source Software Platform of the Future," IEEE
Electrification Magazine, vol. 4, no. 4, pp. 15-22, Dec. 2016. DOI:
10.1109/MELE.2016.2614178. URL:
http://ieeexplore.ieee.org/stamp/stamp.jsp?tp=&arnumber=7725895&isnumber=7725795
Katipamula S, RG Lutes, G Hernandez, JN Haack, and BA Akyol.
2016b. "Transactional Network: Improving Efficiency and Enabling Grid
Services for Buildings." Science and Technology for the Built
Environment (2016), 22(6), pp 643-654 DOI:10.1080/23744731.2016.1171628
Katipamula S, K Gowri, and G Hernandez. 2016c. “An Open-source
Automated Continuous Condition-based Maintenance Platform for
Commercial Buildings.” Science and Technology for the Built Environment
(2016) 00, 1–11 doi: 10.1080/23744731.2016.1218236
Kim W, S Katipamula, RG Lutes, and RM Underhill. 2016. "Behind the
Meter Grid Services: Intelligent Load Control” PNNL-26034, Pacific
Northwest National Laboratory, Richland, WA.
Kim W, and S Katipamula. 2017. "Development and Validation of an
Intelligent Load Control Algorithm." Energy and Buildings, 135 (2016),
pp 62-73. http://dx.doi.org/10.1016/j.enbuild.2016.11.040
About the Authors
 is a Staff Scientist at
Pacific Northwest National Laboratory (PNNL). For over 25 years,
Katipamula’s career has focused on improving the operating efficiency
of commercial buildings. He has extensive technical experience in the
evaluation of advanced design concepts for heating, ventilation and
air-conditioning systems (HVAC), development of automated fault
detection and diagnostic techniques, self-correcting controls,
building, and energy system simulations, analysis and evaluation of new
energy efficient technologies, and development and use of analytical
modeling techniques. At PNNL, Dr. Katipamula leads a number of research
projects in advanced building controls, automated fault detection, and
diagnostics, building operations, and building-grid integration. He is
a fellow of the American Society of Heating, Refrigeration and Air
Conditioning Engineers, the American Society of Mechanical Engineers
(ASME) and former associated editor of ASME Journal of Energy Resources
Technology.
is a Staff Scientist at
Pacific Northwest National Laboratory (PNNL). For over 25 years,
Katipamula’s career has focused on improving the operating efficiency
of commercial buildings. He has extensive technical experience in the
evaluation of advanced design concepts for heating, ventilation and
air-conditioning systems (HVAC), development of automated fault
detection and diagnostic techniques, self-correcting controls,
building, and energy system simulations, analysis and evaluation of new
energy efficient technologies, and development and use of analytical
modeling techniques. At PNNL, Dr. Katipamula leads a number of research
projects in advanced building controls, automated fault detection, and
diagnostics, building operations, and building-grid integration. He is
a fellow of the American Society of Heating, Refrigeration and Air
Conditioning Engineers, the American Society of Mechanical Engineers
(ASME) and former associated editor of ASME Journal of Energy Resources
Technology.
 George
Hernandez joined PNNL in 2009 and works in the Electricity
Infrastructure and Buildings Division. Mr. Hernandez is the Principal
Technical Advisor for Buildings to Grid Integration and Buildings
Controls Research Program Manager. While on detail at DOE’s
Building Technologies Office, he created the Sensors and Controls
program and co-authored the High-Performance RTU Challenge, the
Buildings Performance Database, the Low-Cost Wireless Metering
Challenge, Energy Information Handbook, the Portable Sensor Suitcase,
Open Source Small Building Control System, and the Transactional
Network project. Most recently, he has been guiding the
development of VOLTTRON, an open source agent based software
platform. Mr. Hernandez has extensive knowledge, skills, and
capabilities derived from a substantial career in demand side utility
management across a wide variety of commercial and industrial sectors
and utilities as both a corporate employee and an independent
consultant. Mr. Hernandez received his BS in Mechanical Engineering
from California State University and his Masters in Mechanical
Engineering from The University of California at Berkeley. He is a
Licensed Professional Engineer (PE) by the State of California.
George
Hernandez joined PNNL in 2009 and works in the Electricity
Infrastructure and Buildings Division. Mr. Hernandez is the Principal
Technical Advisor for Buildings to Grid Integration and Buildings
Controls Research Program Manager. While on detail at DOE’s
Building Technologies Office, he created the Sensors and Controls
program and co-authored the High-Performance RTU Challenge, the
Buildings Performance Database, the Low-Cost Wireless Metering
Challenge, Energy Information Handbook, the Portable Sensor Suitcase,
Open Source Small Building Control System, and the Transactional
Network project. Most recently, he has been guiding the
development of VOLTTRON, an open source agent based software
platform. Mr. Hernandez has extensive knowledge, skills, and
capabilities derived from a substantial career in demand side utility
management across a wide variety of commercial and industrial sectors
and utilities as both a corporate employee and an independent
consultant. Mr. Hernandez received his BS in Mechanical Engineering
from California State University and his Masters in Mechanical
Engineering from The University of California at Berkeley. He is a
Licensed Professional Engineer (PE) by the State of California.
[an error occurred while processing this directive]
[Click Banner To Learn More]
[Home Page] [The Automator] [About] [Subscribe ] [Contact Us]