Five Key Techniques for Utilizing Energy
Management Systems
to Reduce Consumption, Costs, and Carbon up to 30%
to Reduce Consumption, Costs, and Carbon up to 30%
|
March 2012 |
[an error occurred while processing this directive] |
|
Five Key Techniques for Utilizing Energy
Management Systems
to Reduce Consumption, Costs, and Carbon up to 30% |
|
| Articles |
| Interviews |
| Releases |
| New Products |
| Reviews |
| [an error occurred while processing this directive] |
| Editorial |
| Events |
| Sponsors |
| Site Search |
| Newsletters |
| [an error occurred while processing this directive] |
| Archives |
| Past Issues |
| Home |
| Editors |
| eDucation |
| [an error occurred while processing this directive] |
| Training |
| Links |
| Software |
| Subscribe |
| [an error occurred while processing this directive] |
With
the recent incentives and building upgrades announced by President
Obama as part of the ‘Better Buildings Challenge,’ facility and
building managers are feeling increased pressure to reduce energy
usage, lower utility costs, and minimize their impact on the
environment.
In all reality, what organizations are looking
to do is lower their overhead costs and increase profitability; the key
place to do this is by lowering energy bills through reducing energy
waste. One of the quickest and most cost effective ways to do this and
decrease environmental impact is to invest in an energy management
software platform.
Below are five simple methods for using energy management software to
help reduce energy consumption, costs, and carbon emissions by up to
30%:
Once
energy consumption data is being fed into an energy management
platform, one of the first places to look for savings is by monitoring
your energy usage during “out-of-office” periods or when the building
should technically be closed. There is always a base load of
energy being used by a building but this should remain constant from
day to day and week to week, and knowing this usage allows you to
easily and quickly spot any energy waste. Our clients are surprised to
find that there are key areas for improvements during in-active periods
of the day, especially when looking at the energy being consumed during
weekends which can often point to something as simple as the heating
and cooling system not being configured correctly for these days.
[an error occurred while processing this directive]
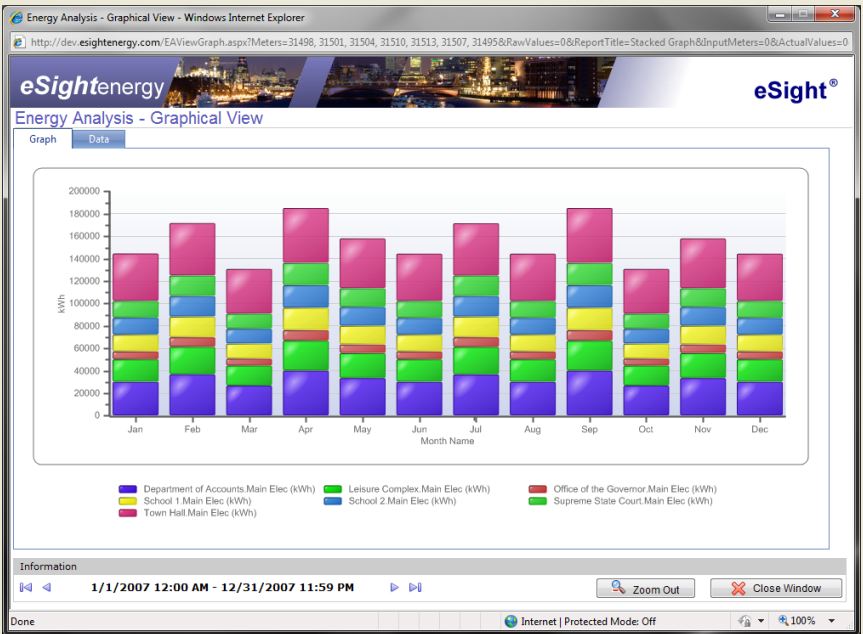
When
looking at a large portfolio of buildings and with limited time, the
most efficient way to reduce energy is to look at the worst performing
sites and asses these first, the ‘low hanging fruit’. However, it is
often misleading to look at just the energy consumption of that
building without taking into account a number of factors that drive the
energy usage, such as season, geographical regions, time of day active
periods, square footage and occupancy numbers. An energy
management system will be able to provide you with normalized data
across your portfolio and this normalization allows users to view the
impact of improvements with clarity over time; it provides a true
“apples to apples” comparison
Taking this a step
further, eSight’s Multi-Variable Linear Regression analysis provides
realistic modelling of performance, normalizing usage against up to 10
driving factors. This technique allows you to compare your actual
usage against the predicted usage based on these factors or to forecast
your energy usage going forward.
Another key piece of
functionality of an energy management system is the ability to alert
and action anomalies. The Exception Reporting Module generates alarms
for automatic distribution via email to identify areas where usage has
gone over a certain peak or valley, outside a certain range, or where
data is missing. This alarming allows you to react quickly to
rectify a problem before it has the opportunity to continue or get
worse, and being received via email means that you do not need to be
continually eye-balling reports. Alarming also helps to identify
areas worth investing on enhancements. If problem areas aren’t
identified, then there is no way to action potentially expensive areas
for simple improvements.
Benchmarking building performance provides ongoing review to
determine if a building is getting better or worse in comparison to
itself, other buildings within the organization’s portfolio, and/or
similar buildings outside the organization. With analyses like year on
year comparisons, energy managers can establish a starting point to
track performance, provide on-going monitoring of building trends, and
locate properties that are getting better/worse on a relative basis;
thus providing accurate justification for improvements.
Once
changes are applied, energy management systems help determine if
initiatives are working by tracking success of upgrades, clearly
measuring ROI of improvements, and providing accurate data reports to
present to management. Benchmarking buildings against other like
properties can also help enhance public image through Corporate Social
Responsibility programs and give a competitive advantage.
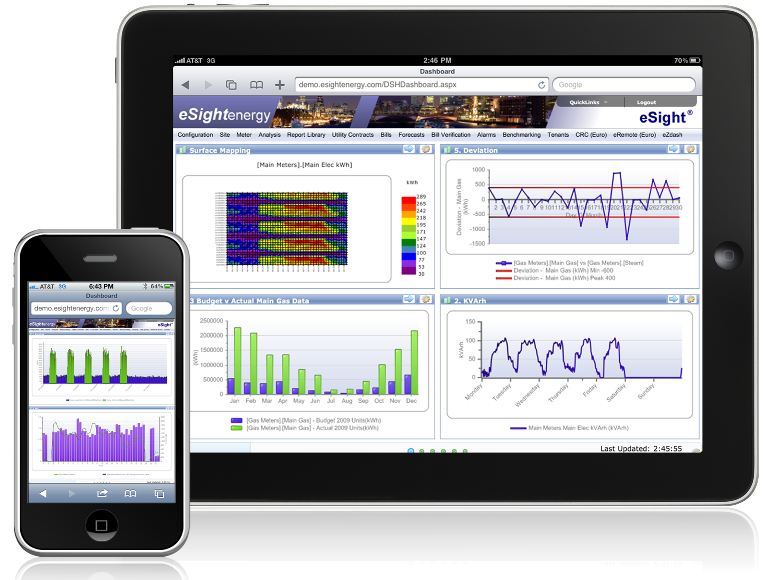
And finally, increase participation throughout the organization by taking advantage of the mobilization of data through smartphones and tablets. With eSight’s web-based technology, users can access energy data “on-the-go.” The more access employees have to energy usage information, the more likely they are to get involved in energy saving initiatives.
For
more information on how organizations are utilizing energy management
platforms to reduce energy consumption, costs, and carbon emissions,
visit www.eSightenergy.com and request a demonstration.
About eSight Energy, Inc.
Developed
by eSight Energy, eSight is the most sophisticated yet intuitive energy
management suite available worldwide. Utilizing 100% web-enabled
technology, eSight offers an extensive range of techniques for
analyzing energy usage to reduce energy consumption, costs, and carbon
by up to 30%. The suite is available as a hosted solution (SaaS) or
installed to any site. eSight may be used to monitor data from
virtually any energy related system including meters and loggers,
building automation and control systems, production data, and data from
any utility type including electricity, natural gas, water, steam,
compressed air, temperature and more. http://www.eSightenergy.com.
[an error occurred while processing this directive]
[Click Banner To Learn More]
[Home Page] [The Automator] [About] [Subscribe ] [Contact Us]