|
October 2014
Article
AutomatedBuildings.com
|
[an error occurred while processing this directive]
(Click
Message to Learn More)
|
|
Where do Whole-Building Analytics Fit
in the Energy Professional's Toolkit?
The need for building energy analysis is growing, the talent
pool of building energy experts is limited. New whole-building energy
performance assessment tools are one way technology innovators are
trying to fill the gap.
|
|
New York City just announced a building retrofit plan to move it
towards the goal of an 80 percent reduction in emissions by 2050.
As municipalities and states make such public commitments, the pressure
is on property owners to comply. This dynamic increases demand
for energy benchmarking, energy audits, energy savings estimates, new
construction and retrofit commissioning, among other activities related
to improving the energy efficiency and comfort of building stock.
Yet, while the need for building energy analysis is growing, the talent
pool of building energy experts is limited. New whole-building energy
performance assessment tools are one way technology innovators are
trying to fill the gap.
Looking at any system from a high-level and as a whole is usually the
best way to get to know its key drivers. The ability to assess energy
performance of whole buildings through a quick data analysis would
certainly be welcome. But, can you extract sufficient information for
business decisions regarding the prioritization Energy Conservation
Measures (ECMs) in this way, given the idiosyncrasies and well-hidden
features of commercial buildings? Answering this question affirmatively
by improving the contributing technologies has been a challenge
embraced by innovators of all stripes. Here is a list to help you sort
the field:
- Model-Based Building Performance Analysis tools that have evolved
as extensions of building information modeling (BIM) tool suites
familiar to architects, engineers and contractors
- Meter and Sensor-Based Remote Building Performance Analytics
coming from new ‘Big Data’ start-ups that are being packaged into
Utility-run energy efficiency programs
- Model-Based Building Performance Diagnostics that productize the
latest Building Science emerging from university programs and research
organizations
- Real-time Operational-Data-Based Building Performance Diagnostics
that plug directly into Building Management Systems (BMS) to gather
data and are thus more of an extension of Building Automation and
Control
The value of the recommendations output
by any of these category of tools is inevitably compared to the
recommended ECMs that come from conventional engineering calculation
approaches.
The Association of Energy Services Professionals (AESP) recently
invited speakers from PG&E, Autodesk and First Fuel among others to
address continuous learners on the topic of software analytics tools
that attempt to remotely assess whole-building energy
performance. This session was captured and is available with slides
and audio here. Based on this
information, plus recent conversations
with commissioning experts familiar with operational building
analytics, here is an overview of how each category is being deployed
today and how the categories might evolve to fill out the energy
professionals’ toolkit.
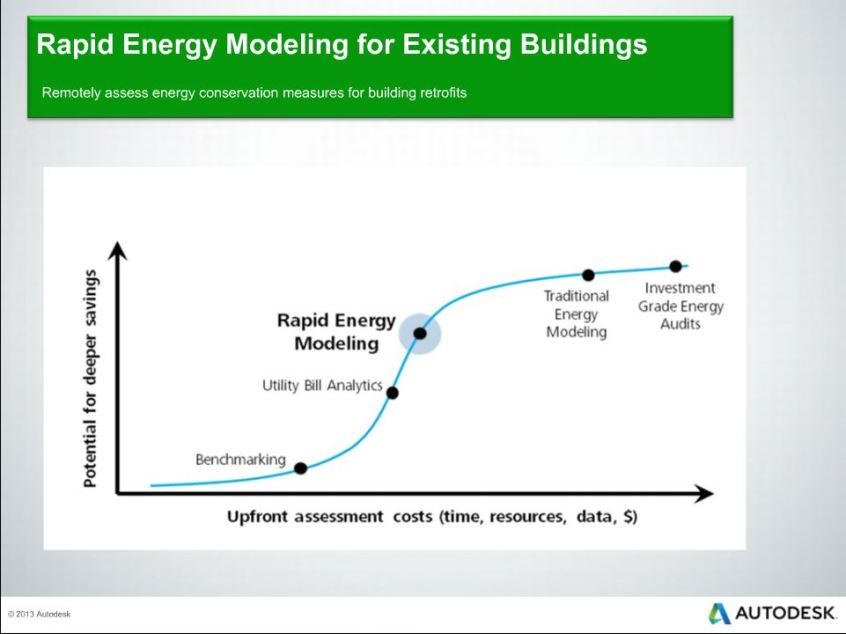
Model-Based
Building Performance Analysis
Building information modeling (BIM) and
advanced simulation approaches like those possible with Autodesk’s
Revit are being used for energy assessments and audits, as well as to
drive deeper energy retrofits. Autodesk’s Aniruddha Deodhar
explained that energy conservation measures recommended by this
modeling approach extend into design changes like daylight controls,
insulation, window upgrades etc. Such fundamental design changes
in the building offer the potential of greater energy savings, than
operational (adjust setpoints) or behavioral (encourage occupants to
turn off lights when not used, e.g.) ECMs alone. Autodesk’s Rapid
Energy Modeling method uses capture options like satellite and aerial
images, photos, drawings, laser measuring, plus basic building data
gleaned directly from Revit building information models.
Autodesk has been working on ease-of-use
of its sophisticated modeling software that evolved to meet the 3D CAD
needs of architects, structural engineers, MEP engineers, designers and
contractors. In the case of Rapid Energy Modeling, Autodesk’s Deodhar
explained that the toolset was designed to be simple enough for a
high-school student to use, which is key due to the scarcity of
graduated energy engineering talent. He pointed out that the models
incorporate the findings of energy savings sensitivity studies for 12
common building types.
Meter/Sensor-Based Remote Building
Energy Performance Analytics
First Fuel uses meter data, mapping
tools, weather data and occupancy data to model a commercial building’s
energy performance. The venture-funded company provides energy auditing
services to commercial building owners that are typically packaged and
delivered through
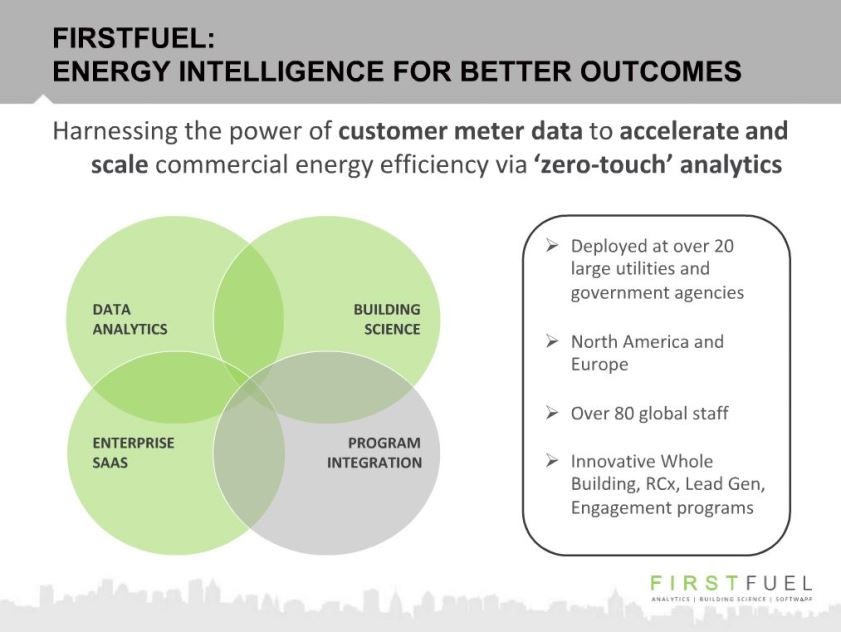
utility partners. Utility partners
use First Fuel’s cloud-based ‘zero touch’ energy assessment tools for
customer engagement and motivation, as well as to enable performance
tracking and regulatory measurement and verification.
One PG&E Emerging Technology program
offers commercial facilities of greater than 50kW in electric demand
the opportunity to find energy savings opportunities using analytics
software provided by First
Fuel and C3.
With the expectation of over 15% post-installation energy savings,
participants are offered an upfront incentive and a performance
incentive tied directly to achieved savings through implementing the
retrofit, as well as operational and behavior efficiency measures
suggested by these in-the-cloud tools.
Hierarchical Modeling and
AFDD-Based Building Performance Diagnostics
The team at KGS Buildings makes a compelling case for a modeling
approach to whole-building energy assessment that also supports a
continuous and connected process as you move up and down through a
building system hierarchy. Diagnosing a detected anomaly, for
example, can require examining operational efficiency of the HVAC
system as a whole, then a series of VAV's all connected to one AHU,
then an individual AHU or an individual VAV, etc. Sometimes
called hierarchical rule-based FDD, or monitoring-based commissioning
(MBCx), software suites like KGS
Clockworks™ have a Fault Detection and Diagnostics (FDD) knowledge
base at the core with decades of accumulated performance data, made
accessible with the latest data search methods. They can provide
an enterprise view across multiple buildings and multiple building
automation system platforms down to individual equipment by comparing
data collected from each facility to its library of diagnostic code
data. Clockworks' library incorporates cooperative research and
development with Pacific Northwest National Laboratory (PNNL) on
diagnostics for outdoor air economizers and whole buildings as well as
retuning algorithms that identify operational inefficiences leading to
comfort and maintenance problems and excess energy consumption. A
book on the topic, entitled Automated Diagnostics and Analytics for
Buildings, has just been released by authors from PNNL and the
University of Florida.
As KGS Partner, Nicholas Gayeski, explains in a recent whitepaper, “A
central challenge for Automated FDD is the need to deploy diagnostics
across many different building profiles, systems and types of
equipment. Effective solutions must avoid re-writing diagnostics with
every new building, which is cost prohibitive, while at the same time
avoid false positives. Clockworks™ addresses both of these two
priorities with a centrally managed code set that is customized to
individual facilities through a scalable software configuration
architecture that enables rapid deployment. This means that a complete
library of diagnostic code can be rapidly applied to individual
buildings, entire campuses or even large building portfolios by mapping
point, equipment and system parameters directly into an internal online
tool that augments the central diagnostic code without re-inventing the
wheel. This is referred to as mass-customization."
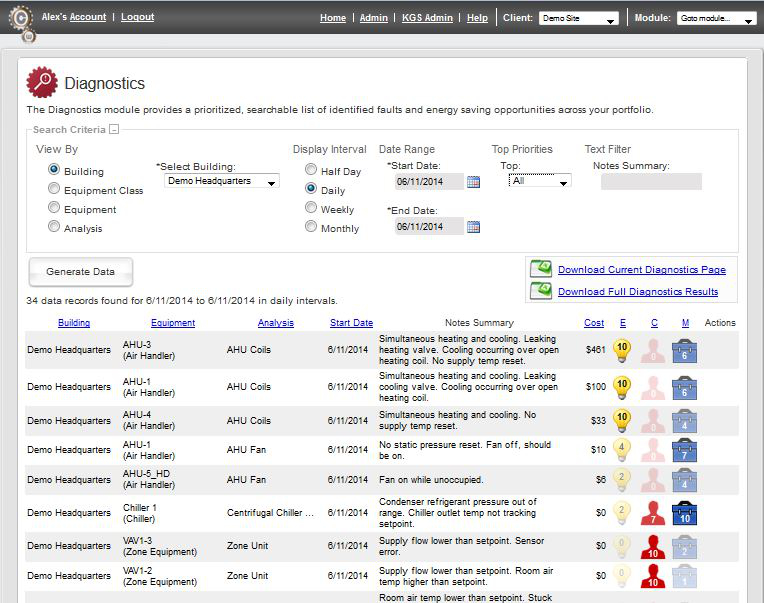
Caption:
Clockworks™ prioritizes the results by energy cost, as well as comfort
and maintenance on a 0-10 scale. All results from equipment and system
level analyses appear in the punchlist that you see above according to
the date range selected. This list can be sorted by portfolio or
individual building, as well as equipment class and type of analyses.
This allows a user to drill into a specific building, piece of
equipment, or type of analysis. The figure above illustrates the
results of diagnostics across a portfolio with a daily interval of 24
hours.
Real-Time Operational-Data-Based
Building Performance Diagnostics
The Connected Building Commissioning
process of Energy Engineering services firm, Altura
Associates, exemplifies yet another approach to
whole-building/whole-portfolio energy assessment. This involves on-site
connection to the building management system (BMS) to extract realtime
data from thousands of measured HVAC, water and lighting points and
feeding this to the cloud-based SkySpark™ fault detection and analytics
platform from SkyFoundry.
From this diagnostic scan, a detailed set of building system-specific
rules is extracted. This results in a fast and deep understanding of
systems performance and the discovery of improvement opportunities.
Altura’s Matt Schwartz is using this
Connected Building Commissioning process for client Pacific Medical
Buildings (PMB) of Southern California. Early program results have
delivered energy cost savings of over 20% per building, representing
annual cost savings of more than $65,000 across just two buildings.
According to Schwartz, “Analytics is not a box that sits on the
wall. You cannot get the job done front-to-back with a hands-off
remote approach. By plugging right into the BMS, we’re not working on
‘Big Data,’ as much as working on the ‘Right Data’. Our mix of
onsite engagement plus cloud analytics includes meeting with staff and
tenants so we understand the ‘people’ component. With this
combination, we’ve been able to knock these assessments out
building-by-building, at an investment on the part of our client that
is relatively low, while returns are high.
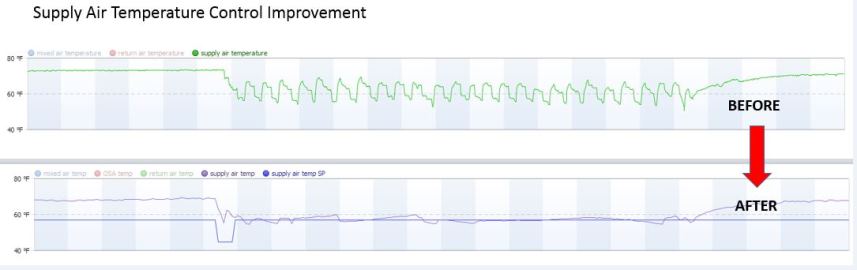
Caption:
Before and After Supply Air Temperature Control. Note the significant
cycling of supply air temperature from the unit before the changes. As
a result of the improvements, occupant comfort is greatly improved and
the lifetime of compressors is extended.
The CBCx process has allowed the team to uncover issues which might
otherwise have gone unnoticed, or been deemed too time consuming to
troubleshoot. The SkySpark visualizations above reveal how a rooftop
HVAC system for one of the facilities was experiencing a high frequency
of cycling due to poor system tuning and control. With a
relatively simple fix (new control logic and tuning parameters), the
system was tuned and tested to decrease the cycling frequency. As a
result, the equipment is now at a much lower risk of failure, comfort
control is improved, and operational costs were significantly reduced.
Conclusion
[an error occurred while processing this directive]
There are many other companies entering the fray when it comes to
software for quickly finding the best opportunities for operational
savings across a whole building or portfolio - and, finding
worthwhile design upgrades like building envelope or lighting
changes. Questions to ask when reviewing offerings include:
- How does the solution integrate with multiple building automation
system platforms?
- Can the assessment method scale across the targeted portfolio?
- What activities are cloud-based versus on-site?
- How does the solution handle the various human-factor facets of
the challenge?
- Will the software offer design upgrade suggestions like changes
to the building envelope and lighting design?
Then don’t spend too much time analyzing
before diving in because, by tomorrow, each of these categories will
have evolved and merged in ways we haven’t thought of yet.
footer
[an error occurred while processing this directive]
[Click Banner To Learn More]
[Home Page] [The
Automator] [About] [Subscribe
] [Contact
Us]