|
September 2015 |
[an error occurred while processing this directive] |
|
Solar Panel Analysis Demonstrating the power of building operational analytics to keep unattended distributed power systems functioning as intended. |
| Articles |
| Interviews |
| Releases |
| New Products |
| Reviews |
| [an error occurred while processing this directive] |
| Editorial |
| Events |
| Sponsors |
| Site Search |
| Newsletters |
| [an error occurred while processing this directive] |
| Archives |
| Past Issues |
| Home |
| Editors |
| eDucation |
| [an error occurred while processing this directive] |
| Training |
| Links |
| Software |
| Subscribe |
| [an error occurred while processing this directive] |
Background:
Low-rise buildings in sparsely-developed
locations are ideal for the business of offering rentable storage units
for the safekeeping of goods. With more Americans choosing to live in
smaller urban spaces and the American tendency to buy a lot of stuff—
there is no shortage of customers for these businesses. There are
hundreds of self-storage operators with dozens of such facilities
across the United States. Another good business match is between
storage franchises and solar power generation. Their buildings have
ample roof space for installing photovoltaic panels and typically have
few obstructions to block the sun and compromise solar energy
production. They save on energy costs and boost net operating income by
setting up their own distributed power systems. However, such
self-service-oriented businesses have an inherent challenge with their
geographically-dispersed solar installations as well: lack of onsite
operator oversight. There is not much sense in installing a distributed
PV power generation network unless measures are in place to ensure that
all the equipment is functioning as intended. The performance of
individual panels can degrade and fail, power inverters can
inefficiently convert from DC to AC, and sensors designed to detect PV
function can be faulty. Other components and sub-processes can
malfunction too. This is why, when one national storage chain recently
added PV power generators to 23 of its self-storage sites from Texas to
New Jersey, they hired BASSG to setup an intelligent energy management
system that would enable ongoing remote monitoring of solar panel
energy production.
As a SkySparkⓇ partner, BASSG quickly customized a solution that
captured, analyzed and presented the data flowing from PV inverters and
power meters at each of the sites. The project described here was
completed in just 5 days. While this is a relatively simple
SkySpark® Analytics use case, it is prototypical of the way facility
energy management teams can manage and derive value from the data
streaming from the wide range of systems and devices found in today’s
intelligent buildings and equipment. We present it here as a learning
opportunity for those just getting to know the power of building
operational analytics. This case study walks through the process
of 1) conceptualizing the data plan, or schema, that will deliver the
desired insight 2) preparing the raw data according to the needs of
that schema 3) defining the machine rules to run against that data and
4) interpreting the resulting visualizations.
Conceptualizing: “Finding What
MattersTM”
Building operators and facility managers that have long experience with
their buildings can easily recognize the signs and signals of something
going wrong — they know what matters. Their challenge is to translate
that specialized, intimate knowledge into rules that a data analytics engine
can process continuously and automatically when fed time-series data
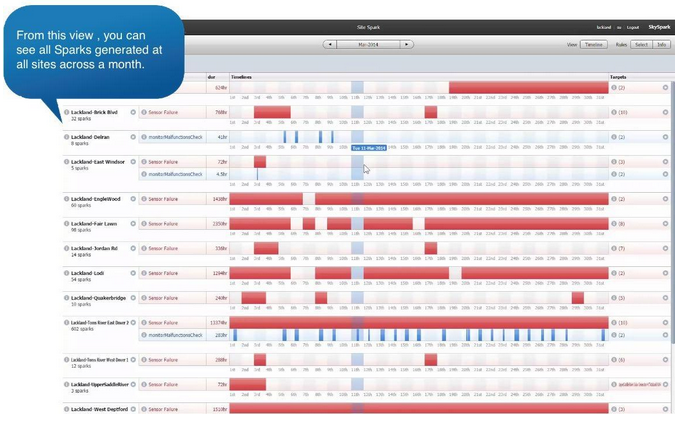
from building equipment. In the SkySpark environment machine rules and
the alerts that result from rule violations are called Sparks.
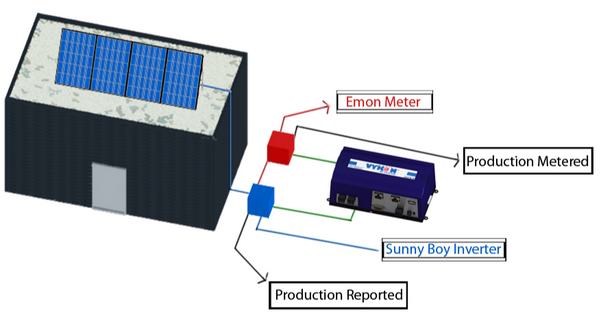
The solar energy systems installed at 23 sites
feature the standard configuration of a series of roof-top PV arrays
that feed their production to solar inverters. The inverters
convert the variable direct current (DC) output into alternating
current (AC) so that it can be used to power the facility’s lights,
heating/cooling, security systems, etc. DC energy produced by each PV
array is metered by multiple E-Mon sub-meters. And the multiple
Inverters meter the amount of AC energy output. These readings are
captured at standard 15 minute intervals.
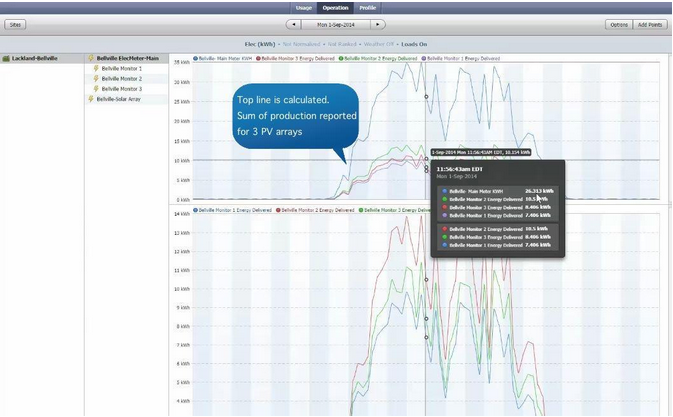
It’s difficult to glean any insightful information from the raw data
streaming from the various individual sources. Calculated histories
need to be derived to make clear how much total energy was produced and
output by the various arrays and the PV system on the whole.
The data needs to be structured to find things that matter, such as:
Spark rules and visualizations are
needed to find any of these potential scenarios. And prior to running
these rules through the data analytics engine, the raw data needs to be
prepared with these queries in mind.
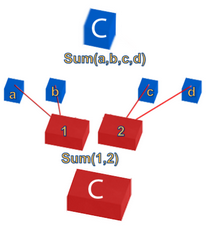
Preparing the Raw Data
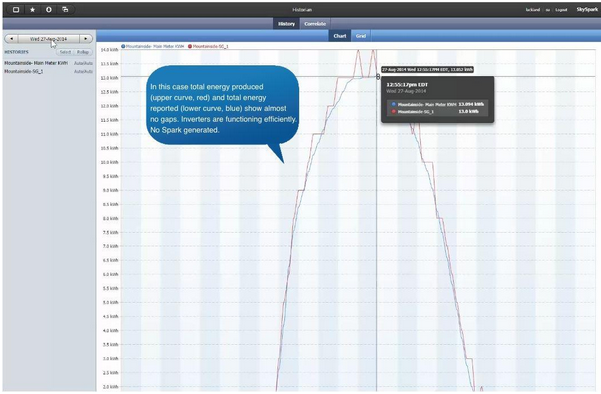
To efficiently verify that the inverters are functioning correctly for each site, totals are needed for DC energy produced and for AC energy reported per interval, i.e. point in time. To create these calculated histories, the time-stamped production data from each E-Mon sub-meter is put through a summing operation in SkySpark and, likewise, the interval data from each inverter at the site is summed.
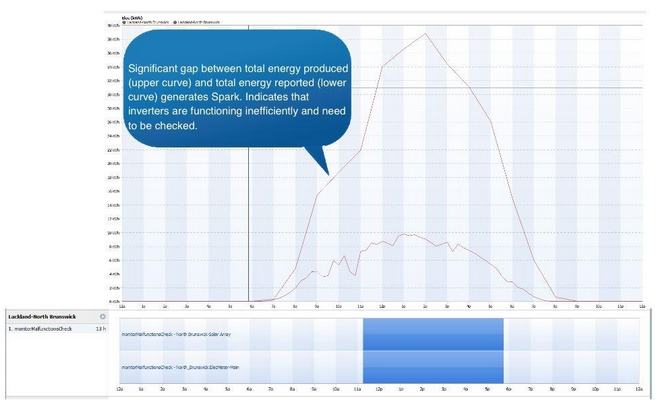
Defining Rules to Generate Sparks
Once the data has been prepared to
reflect totals, it is straightforward to write a rule for SkySpark
analytics to automatically detect inverter inefficiency faults.
Interpreting
Alternate Views
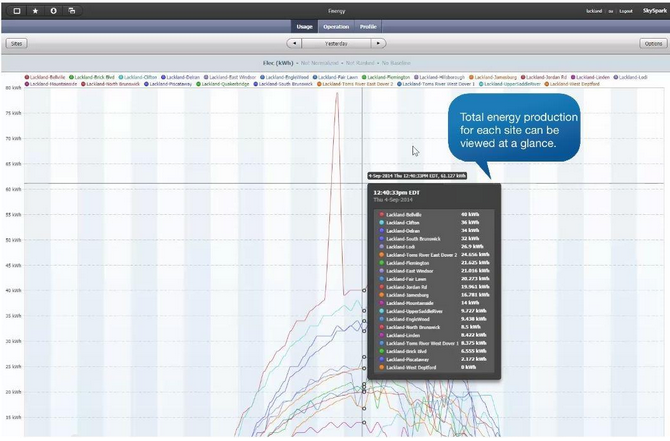
Calculated histories also ease
comparisons of whole buildings, or whole sites, as in this case.
This SkySpark Analysis looks at the max
energy produced value recorded at each site across an entire
month.
[an error occurred while processing this directive]
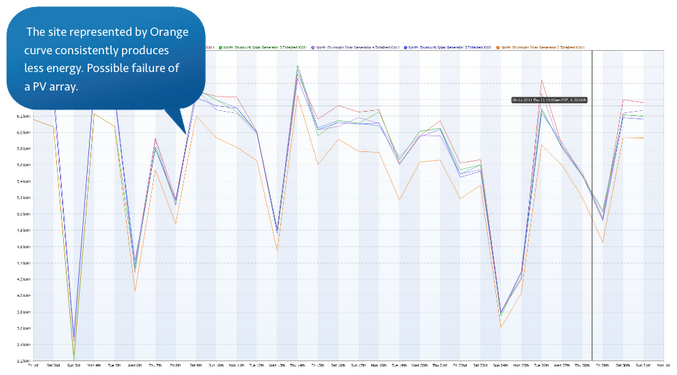
Rules can also be defined to generate
Sparks when sub-par production results or total gaps in energy
production are recorded, indicating potential PV failures.
Another concept for the future would be to create a calculated history
for production ratings based on weather data. The flexibility of the
SkySpark platform allows the sophistication of analyses to grow to meet
the needs of the application.
BASSG
is an intelligent building solutions company with more than 15 years of
experience and more than 200+ clients and full-time programmers on
staff that know the languages and protocols of the Buildings IoT. You
can learn more at http://bassg.com/.
[an error occurred while processing this directive]
[Click Banner To Learn More]
[Home Page] [The Automator] [About] [Subscribe ] [Contact Us]