Visualization
The Key to Improving Building Performance
The Key to Improving Building Performance

John Petze, C.E.M., Partner,
|
January 2012 |
[an error occurred while processing this directive] |
|
Visualization
The Key to Improving Building Performance |
John Petze, C.E.M., Partner,
|
| Articles |
| Interviews |
| Releases |
| New Products |
| Reviews |
| [an error occurred while processing this directive] |
| Editorial |
| Events |
| Sponsors |
| Site Search |
| Newsletters |
| [an error occurred while processing this directive] |
| Archives |
| Past Issues |
| Home |
| Editors |
| eDucation |
| [an error occurred while processing this directive] |
| Training |
| Links |
| Software |
| Subscribe |
| [an error occurred while processing this directive] |
There is a saying that
you can’t control what you don’t measure – it’s
the basis for any type of control. The control loop watches (or
measures) the value of a “process variable” (like room temperature) and
adjusts the position of some control element (like a valve) to achieve
the desired value (setpoint) for the process variable. These types of
feedback control loops are a fundamental part of any BMS – there are
hundreds to thousands of them in a typical system.
When we implement a BMS, we set up our control loops with the best of
intentions based on the knowledge we have about the operation of the
systems. The response the system provides is based
on the way we have defined the control sequence. If we did a good job,
the control loop will maintain the setpoint.
But our job as facility managers/energy managers is bigger than to
simply insure that setpoints are maintained. It is our responsibility
to insure that the building operates optimally and efficiently. For
example, the system might be able to maintain the setpoint by running
heating and cooling simultaneously. This is surely not what we wanted.
Looking deeper, we may want to know what the optimal setpoints should
be. Should they be different than the initial settings? Should they
change over time to reduce energy use while still achieving comfort
goals? Is the control loop responding appropriately? What is the energy
performance under varying load conditions? These are the things we need
to measure to achieve our goals for efficient operation of the
facility.
So as a facility manager what are the “process variables” we need to
monitor to insure our control loop works optimally? We might start by
looking at key metrics like: watts/sqft, or kw/sqft/degree day. We
could then compare our values to benchmarks, or baselines to “see”
where we stand. But if we find that our key metrics are not in the
desired range then what? In reality, we have to measure – or
see – a huge variety of factors in order to make our facilities run
optimally.
We need to look at a huge amount of data in order to understand how our
equipment systems really operate so that we can identify the conditions
that are causing them to use more energy than desired, or result in
other measures of unacceptable performance. And, the things we need to
look at are not simply “limit-based” relationships. We need to take
into account trends and deviations over time, and the complex
interactions that occur between different systems under changing
environmental conditions.
This presents significant challenge – how can we “see” the
operation of all of our systems and devices and the interactions and
behaviors that are not optimal? It’s simply not possible to accomplish
with purely human effort. We need to augment our abilities with
software technology. And that is where “visualization” and the new
generation of analytic tools come in.
[an error occurred while processing this directive]
If we think about the amount of information associated with the
equipment systems in a typical building we quickly see that we would
need an army of experienced mechanical engineers reviewing every bit of
operational data every minute to find issues. Of course, this is simply
not viable. So how can we accomplish the goal of tracking the operation
of every system and identifying operational issues, and opportunities
for improved operation?
Analytics software does exactly this for us. Analytics software
automatically analyzes the data coming from our control systems, meters
and sensors and applies rules or algorithms to look for patterns that
represent equipment faults, performance deviations, and opportunities
for improved performance and cost savings. Here are some simple
examples of the things that analytics software finds in actual
applications:
Below is a view showing how analytics findings are visualized for the
operator:
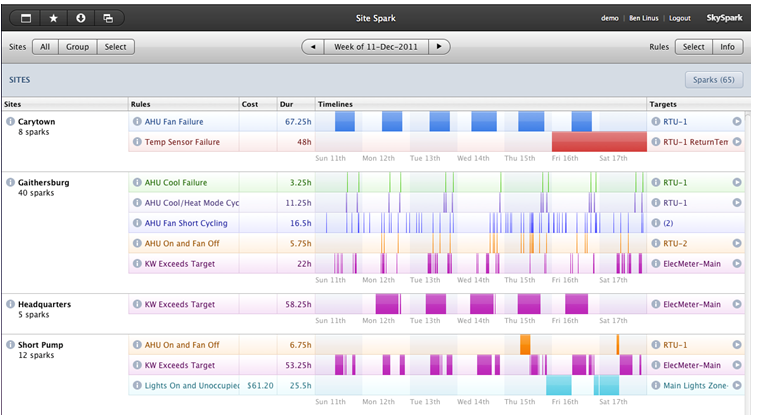
The sample screen above shows analytic results across a 4 building
portfolio for last week. From left to right the view shows: the name of
site and total number of issues detected, name of rule that identified
the issue, the cost and duration of issue, a timeline showing when
issues were detected, and the specific equipment system (target)
involved in the detected issue.
Analytics software is a key part of the revolution in data
visualization that is enabling us to truly understand how our systems
operate and identify the issues that really matter to help us improve
facility operations.
About the Author
John Petze, C.E.M., is a partner in SkyFoundry, the developers of
SkySpark™, an analytics platform for building, energy and equipment
data. John has over 25 years of experience in building automation,
energy management and M2M, having served in senior level positions for
manufacturers of hardware and software products including Andover
Controls, Tridium, and Cisco Systems. At SkyFoundry he rejoins Brian
Frank, co-founder and chief architect of Tridium’s Niagara Framework,
as they look to bring the next generation of information analytics to
the “Internet of Things”.
[an error occurred while processing this directive]
[Click Banner To Learn More]
[Home Page] [The Automator] [About] [Subscribe ] [Contact Us]