October 2005
![]()
AutomatedBuildings.com
[an error occurred while processing this directive]
(Click Message to Learn More)
October 2005 |
[an error occurred while processing this directive] |
|
|
|
September 7, 2005
Mary Ann Piette
David S. Watson
Naoya Motegi
Norman Bourassa
Lawrence Berkeley National Laboratory
Contract Manager
Dave Michel
Contract 500-03-026
Sponsored by the California Energy Commission
PIER Demand Response Research Center
Deliverable 3.1h
LBNL Report Number 58178
To read the complete report: http://drrc.lbl.gov/drrc-pubs1.html
Executive Summary
|
|
|
|
|
|
|
|
|
|
|
|
|
|
|
|
|
|
|
|
|
|
|
[an error occurred while processing this directive] |
Introduction
This report describes the results of the second season of research to develop and evaluate the performance of new Automated Demand Response (Auto-DR) hardware and software technology in large facilities. Demand Response (DR) is a set of time dependant activities that reduce or shift electricity use to improve electric grid reliability, manage electricity costs, and provide systems that encourage load shifting or shedding during times when the electric grid is near its capacity or electric prices are high. Demand Response is a subset of demand side management, which also includes energy efficiency and conservation. The overall goal of this research project was to support increased penetration of DR in large facilities through the use of automation and better understanding of DR technologies and strategies in large facilities. To achieve this goal, a set of field tests were designed and conducted. These tests examined the performance of Auto-DR systems that covered a diverse set of building systems, ownership and management structures, climate zones, weather patterns, and control and communication configurations.
Electric load shedding that is often part of a DR strategy can be achieved by modifying end-use loads. Examples of load shedding include reducing electric loads such as dimming or turning off non-critical lights, changing comfort thermostat set points, or turning off non-critical equipment. Levels of automation in DR can be defined as follows. Manual Demand Response involves a labor-intensive approach such as manually turning off or changing comfort set points at each equipment switch or controller. Semi-Automated Demand Response involves a pre-programmed load shedding strategy initiated by a person via centralized control system. Fully-Automated Demand Response does not involve human intervention, but is initiated at a home, building, or facility through receipt of an external communications signal. The receipt of the external signal initiates pre-programmed shedding strategies. We refer to this as Auto-DR. One important concept in Auto-DR is that a homeowner or facility manager should be able to �opt out� or �override� a DR event if the event comes at time when the reduction in end-use services is not desirable.
Research Overview
The research described in this report was conducted in 2004 following the
first year of tests in 2003. There were a number of specific objectives of the
2004 Auto-DR tests. One objective was to explore new control and communication
systems; both gateway and relay technologies were tests. Another objective was
to evaluate the size of the electric shedding potential of the 2003 Phase 1
buildings in warmer weather test events than our schedule permitted in 2003.
These buildings participated in a warm weather 2004 �Retest�. A third objective
was to evaluate how the test could be scaled up to allow more buildings to
participate. A fourth objective was to better understand the range of electric
shed strategies that are used in large facilities. These last two objectives
were evaluated in a �Scaled Up� test. All of the 2004 tests were three hour shed
events conducted at different times. The facility managers were unaware of the
impending DR events.
The communication systems for the 2004 tests differed from the 2003 tests in that new methods of communication were used. During the 2003 test all of the sites had some sort of Web-based Energy Information System (EIS) and Energy Management and Control System (EMCS) with PC. During 2004, five of the 18 sites used an Internet relay that connected directly to the EMCS control panel. This new method allowed buildings with conventional control systems to participate in the test.
The test evaluation consisted of measuring the electric load sheds during each test event. A robust weather-normalized baseline model was developed for each building based on ten previous days of 15-minute whole-facility electric loads from the existing utility meters. Each shed event was evaluated with a common set of shed metrics. These metrics included include the average and maximum demand (power) savings for each hour of the three-hour test period (kW), the average and maximum demand (power) intensity shed for each hour (W/ft2), and the average and maximum percent savings from the baseline for each hour (%). The shed savings for each building and the aggregated total across all test sites shed savings were estimated (kW).
Results
Participation � The project was successful in recruiting, configuring, and
testing over 10 million ft2 of facility floor area, with each site participating
in at least one of the 2004 tests. The participants included 18 geographically
distributed sites, covering 36 buildings. The participants include several
office buildings, plus a supermarket, cafeteria, industrial process sites,
university library, and a postal processing and distribution center. New
technology was developed to explore and evaluate the capabilities of current
controls and communications for Auto-DR with EMCS and XML. The project involved
extensive outreach and recruitment efforts, and general publicity to audiences
such as building engineers, utilities, property management companies,
commissioning providers, and energy policy community. The Retests occurred on
September 8th and 21st. The Scaled Up tests occurred on October 13th and
November 5th. While each site participated in at least one test, there was no
test where all of the sites worked as planned. The range of problems and issues
that occurred during the preparation and execution of these tests illustrate the
type of technical challenges that exist for future DR control and communication
systems.
All but two of the Auto-DR test sites were in California. The Canadian and Wisconsin sites participated to better understand the XML technology and the electric price server. Although most of the sites were in California, some of the price clients and technology development sites were outside of California. Figure E 1 shows the geographic location of the pilot (test) sites along with the Web-based price clients, price server, and development sites.
Figure E 1: Geographic Location of Pilot Sites and Related System Sites
Demand Savings � Results from the Retest of the five sites also evaluated in 2003 are as follows. The power reduction reached nearly 1 W/ft2 for three of the five sites during the September 8th test, which was more successful in achieving large savings than the September 21st test. The largest individual savings were observed from strategies that used a cooling zone set point increase. Lighting, anti-sweat heaters, and other HVAC strategies were also pursued. The maximum aggregate savings over the three-hour shed was 1453 kW, or about 24% of the total aggregated demand for all five sites. There were negative savings at some of the sites during part of the shed, but each site achieved some savings during at least one of the shed hours. Negative savings can occur when the baseline model predicts the power should be less than the power observed during the particular shed hour. These demand intensities suggest there is significant demand reduction potential in large buildings and commercial facilities during warm weather. No occupant complaints were registered even with these large reductions in whole-building power. Figure E 2 shows the aggregated and individual load shapes of the five Retest buildings during the September 8th test. The baseline load shape is the sum of the individual baselines from each of the five sites. The individual buildings reduced between 5 to 30% of whole building power, with average power reduction of 11%, 24%, and 16% during the 3 hours of the test.
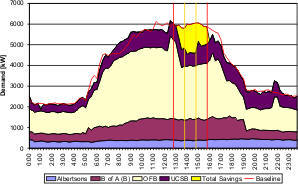
Figure E 2: Aggregated Demand Savings with a Maximum of 1453 kW Shed, Sept.
8th Retest
Results of the Scaled-Up test are as follows. Seventeen sites participated in the Scaled-Up test (one Retest site did not participate because a communication system was out of service following the Retest). Lighting, HVAC and a few other miscellaneous end-use load shed strategies were pursued. Figure E 3 shows the maximum 15-minute demand savings (kW) from 15 of the 18 sites that participated in the 2004 test events. Maximum savings from the Retest are also shown. Three of the 18 sites participated in the communications test only and not the demand savings analysis because of limited metering or being out of California.
On the November 5th test event the aggregated maximum savings among all 15 sites reached nearly 2.5 MW. Only 15 of the total 18 sites are included in this graph because the other three sites were involved in tests that involved the communication system only, and not measurement of the load shed. If all 15 sites reached their maximum shed simultaneously, a total of about 4 MW of demand response is available from these 15 sites that represent about 10 million ft2 of floor area. Demand savings per site ranged from negative savings up to 1080 kW per site, with percent savings from zero to 42 %. Among the four test events, maximum savings per site were 0.01 to 1.81 W/ft2, or 0.1 % to 56 % shed with an average from these 15 sites of 0.53 W/ft2 and 14 %.
Figure E 3: Maximum Demand Savings for the September, October, and November Tests by Building, Total Aggregated Maximum Shed for Each Test, and Non-Coincident Maximum
[an error occurred while processing this directive] This research has demonstrated that fully automated demand response systems are technically feasible for buildings with a wide range of control systems from highly sophisticated EMCS with telemetry communication to conventional EMCS. We demonstrated the features of Automated DR with EMCS and XML (eXtensible Markup Language). Both Internet gateways and Internet relays were tested. There are important pros and cons to these two systems. The Internet gateways are more sophisticated, having a greater set of functions. They are, however, more expensive as well. Further work is needed to continue to evaluate the shed strategies possible for a broad range of building systems, building type, and climatic conditions. Further research is also needed to determine the economics of such DR, evaluate reasonable scenarios for the frequency and duration of sheds, and possible occupant and tenant issues.
Acknowledgements
The authors are grateful for the extensive support from numerous individuals
who assisted in this project. Special thanks to Ron Hofmann for his
conceptualization of this project and ongoing support. Thanks also to Laurie ten
Hope (CEC) and Dave Michel at the CEC. The authors also thank the Technical
Advisory Group that provided feedback to the project design and Christine
Shockman for her assistance in evaluating the decision making perspectives of
the participants. This work described in this report was coordinated by the
Demand Response Research Center and funded by the California Energy Commission,
Public Interest Energy Research Program, under Work for Others Contract
No.150-99-003, Am #1 and by the U.S. Department of Energy under Contract No.
DE-AC02-05CH11231. This project could not have been completed without the
extensive assistance from building owners, facility engineers, project managers,
and technology developers.
About the Author
Mary Ann Piette is a Staff Scientist at Lawrence Berkeley National Laboratory and the Research Director of the PIER Demand Response Research Center. She has been a building science researcher at LBNL since 1983 and has extensive experience evaluating the performance of energy efficiency and demand response in large facilities. The PIER Demand Response Research Center is a new Center to plan, manage, conduct and disseminate DR research for the California Energy Commission. The Center will help conduct research to link energy efficiency and DR technologies, practices, and strategies. Ms. Piette has a Masters of Science Degree in Mechanical Engineering from UC Berkeley and a Licentiate from the Chalmers University of Technology in Gothenburg, Sweden.
[an error occurred while processing this directive]
[Click Banner To Learn More]
[Home Page] [The Automator] [About] [Subscribe ] [Contact Us]