April 2010
![]()
AutomatedBuildings.com
[an error occurred while processing this directive]
(Click Message to Learn More)
April 2010 |
[an error occurred while processing this directive] |
|
|
Dave Krinkel, |
As AutomatedBuildings.com has well documented, we are witnessing an explosion in the availability of interval energy data. Smart meters, low-cost submeters, and wireless monitoring devices are providing even small energy users with access to sub-hourly load data.
|
|
|
|
|
|
|
|
|
|
|
|
|
[an error occurred while processing this directive] |
|
|
|
|
|
|
|
|
|
|
|
|
|
|
|
[an error occurred while processing this directive] |
But what to do with this information? The hot apps right now focus on real-time alerting via web, email, pager, barking dog (I’m sure someone is working on the dog angle). And neat dashboards which continuously monitor use, demand, outdoor temperature, whatever.
By my totally unscientific survey, these wonderful apps cover less than 2% of the loads stored in various databases. That leaves a vast repository of unexamined historic energy information. And that information can tell you if your facilities are operating as expected, and occasionally even identify specific opportunities for significant energy savings.
Here’s what I mean – if you systematically look at say a year’s worth of load data, you will see patterns. Some are obvious:
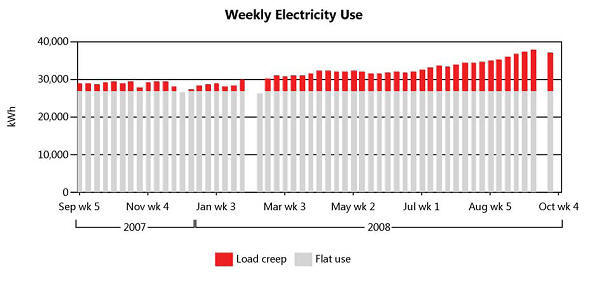
“Long term
electricity use trends significantly upward. This may indicate continuous load
creep. Energy use rises by an average of 159 kWh from week to week. When added
up over the entire 56 week analysis period, this increase accounts for 14% of
the total electricity use, at an estimated cost of $20,500.”
If you look even deeper, you can find deviations from the patterns:
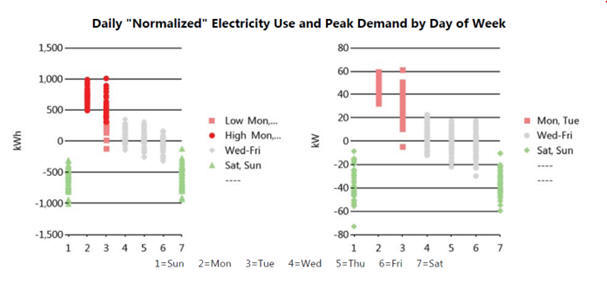
“Mondays and Tuesdays average higher daily energy use than the other weekdays.
Saturdays and Sundays have the lowest daily use. Based on the average
electricity price over the analysis period, the daily cost for Mondays and
Tuesdays is $50 higher than for Wednesdays through Fridays.”
And occasionally you can even find patterns in the deviations:
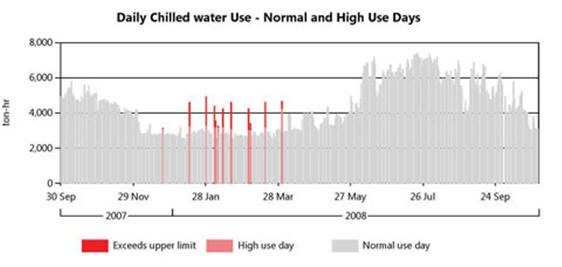
“Chilled water
use exceeds the expected daily range on 12 days in the analysis period. While
the excess use from those days represents less than 2% of the total chilled
water use for the period, the cost is significant, estimated to be $1,880. 92%
of the high use occurs on Mondays.”
A new service called “EnergyAI™” does just this – it systematically analyzes interval energy data to identify unusual use patterns, and quantifies savings opportunities in avoidable energy use, cost, and greenhouse gas emissions.
[an error occurred while processing this directive] This service unlocks the secrets in that unexamined 98% of load data. A recent survey done of a year of data for 588 electric, chilled water, and steam meters found significant savings potential in 93 facilities, totaling 2.3 million dollars. The average avoidable savings were $24,600 and 153 tons of CO2 emissions per facility.
If there are valuable savings opportunities in this data, why is it ignored? Because the job description for facility and energy managers does not include sifting through lots of meter data to find the nuggets. In the survey just cited, savings opportunities were found in less than 30% of the facilities. It’s not a cost-effective use of time to do this manually.
This means that getting an EnergyAI™ analysis had better be really easy. And cheap.
There’s no hardware or software to install, nor are real-time connections with data collection devices or databases needed. Anyone with interval energy data simply downloads up to a year of readings for one or more loads into a file, and sends it via the website (www.energyai.com). The “Load Analysis” report is sent back to them, usually within a day.
This service recognizes the download formats of all leading energy management systems and utility-hosted web sites. There is no need to reformat or clean the data. Just send the meter data and get the report.
The price is $20 per load. The analysis covers up to
a year of data, so one report per year is usually sufficient.
Collecting energy data used to be the hard part. Now the challenge is extracting
value from the overwhelming volume of data. EnergyAI™ offers an easy,
inexpensive way to meet this challenge and reveal your meters’ secrets.
About the Author
Dave Krinkel is the founder of EnergyAI (www.energyai.com), based in
Berkeley, CA. In 1978 he was a researcher in the pioneering Energy Efficient
Buildings team at Lawrence Berkeley National Lab. For the last 25 years, Dave
has developed energy analysis tools for utilities, ESCO’s, and a wide variety of
industrial, commercial, and institutional end users. Prior to EnergyAI, Dave
held senior positions at Itron, Silicon Energy, and SRC Systems. He can be
reached at dkrinkel@energyai.com.
[an error occurred while processing this directive]
[Click Banner To Learn More]
[Home Page] [The Automator] [About] [Subscribe ] [Contact Us]