Demand Management for Facilities Professionals
A demand management strategy is easy to implement and will yield
savings on commercial electric bills.

Wayne Wiebe
Senior Vice President,
Kenmark Group
|
August 2012 |
[an error occurred while processing this directive] |
|
Demand Management for Facilities Professionals |
Wayne Wiebe Senior Vice President, Kenmark Group |
| Articles |
| Interviews |
| Releases |
| New Products |
| Reviews |
| [an error occurred while processing this directive] |
| Editorial |
| Events |
| Sponsors |
| Site Search |
| Newsletters |
| [an error occurred while processing this directive] |
| Archives |
| Past Issues |
| Home |
| Editors |
| eDucation |
| [an error occurred while processing this directive] |
| Training |
| Links |
| Software |
| Subscribe |
| [an error occurred while processing this directive] |
Two buildings set
close to downtown San Jose make up the Echelon
campus. Echelon is the inventor of a controls protocol called
LonWorks. The buildings have extensive control networks which
allow fine grain control of building systems. The structures are
panel and single pane glass exterior walls; a standard built-up roof
and minimum insulation. The buildings are very susceptible to
exterior conditions like outside air temperature (OAT) and thermal
load. Fortunately, the management team has made reduction of the
utility budget a priority and realized fiscal and sustainability
benefits. For the last ten years the cost of electricity has
remained nearly flat due to innovative energy conservation
programs. They have found that participation in incentive
programs like demand response, and peak day pricing yields significant
cost reduction. A similar way to reduce cost by implementing
short term consumption control is called demand management.
All major
utilities have demand components in each of the commercial
and industrial rate structures they use to charge customers. The
demand charge is based on a $/kW rate multiplied by the highest rate of
consumption for one 15 minute period during the billing
cycle.1 Typically this accounts for between 10 and 25
percent of the bill. The rates tend to be higher where consumption
rates are higher; in metropolitan areas, and the Northeast and West
Coast.
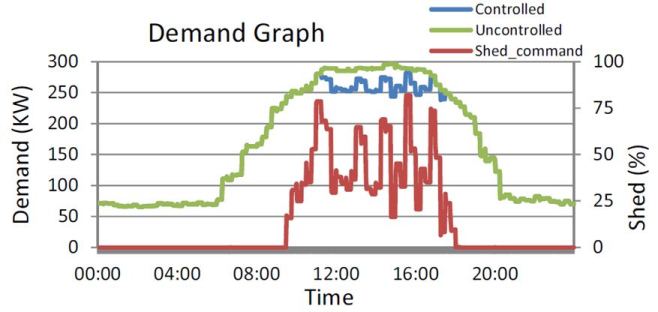
Demand management is the reduction of demand charges. Control the electric consumption and, over the short term intervals that measure demand, demand charges will be reduced. The system we use relies on three techniques: raise supply air temperature and reduce the load on the compressors; lower duct static pressure and reduce the load on the supply fans; turn off non-essential lights.2 The DCS delivers instant data on consumption and demand. Every weekday the demand curve follows a profile with a peak between noon and 4:00 PM. In a similar exercise that many buildings perform to respond to a demand response event, demand is reduced with minor reductions throughout the afternoon.
Only a few days in
a billing cycle need to be controlled. It is
possible to predict these days based on your knowledge of past building
performance; however, we use a commercial service called Snapmeter from
Gridium.3 At the beginning of each week we received a
Snapmeter Email predicting
specific days that will have high demand and
what the highest demand will be in the billing cycle.
When Echelon
started applying demand management we achieved
satisfactory results. We saved $100 to $200 per month without any
impact to comfort. This phase involved manually setting
reductions from about 10:00 to 4:00 every day. After a few
missteps involving sauna-like conditions for officers of the company,
we were motivated to gain better control to interact with the DCS.
We developed an algorithm to automatically hold the demand below a
certain cap kW. The algorithm calibrates the same components we
use in a demand response event but with a level of control of +/-
1%.
The algorithm
takes Cap and Band kW numbers (see Figure 2) and
calculates the difference. The difference, or band, is calibrated
from 0 to 100. As the demand climbs during the specific day we
have set a cap, it generates a “% shed” number. The % shed is
used to adjust supply air temperature between 55 and 65 degrees, and
duct static pressure between 1.5 and 0.2 inches of water.
Additionally, at 90% shed the non-essential lights turn off.
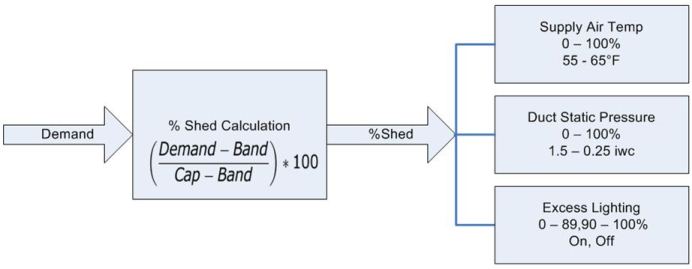
For example, if Cap is 300 kW and Band is 250 kW then when the demand reaches 275 kW the algorithm will set % shed at 50 and supply air temperature will be set at 60 degrees and duct static pressure will go to 0.85 inches. To further our example, once the demand reaches 295 kW a little while later the non-essential lights will be turned off.
[an error occurred while processing this directive]The
system Echelon
set up has saved $6,806 in six months. This
number comes from a comparison of a normalized model using last year’s
data. The most recent bill has savings of $558 in usage (4.4% of
line) and $922 in demand (15.3% of line). This was a reduction of
$1,480 or 8.2% of the bill. Demand management is most effective
in the spring and fall because of the wider temperature variations
during the billing cycle, but we expect stable savings through the
summer.
Although we have
described a fairly complex algorithm for demand
management, much simpler processes have been shown to work.
Additionally, the retrofit of a targeted control system for a 10 to 30
ton roof top unit devoted to this algorithm would cost between
$5,000 and $8,000 to install. It is a simple exercise to
calculate an ROI with the electric bill data. We recommend that all
managers responsible for the utility budget line item examine the
feasibility of demand management.
Please go to www.kenmarkcontrols.com for more information.
_____________________
1 An
interesting history and analysis of how this charge became
commonplace can be found in John L.
Neufeld (1987). Price
Discrimination and the Adoption of the Electricity Demand Charge. The
Journal of Economic History, 47 , pp 693-709
doi:10.1017/S0022050700049068.
Link:
http://www.jstor.org/discover/10.2307/2121336?uid=3739560&uid=2129&uid=2&uid=70&uid=4&uid=3739256&sid=56315069543
2 Another solution is a battery pack which will store
energy and
discharge it at the consumption peaks. For an example, please
follow this link:
https://www.google.com/calendar/b/1/render?tab=mc.
3 For
more information about the Snapmeter demand prediction service follow
this link: http://www.gridium.com/snapmeter/.
About the Author
Wayne Wiebe is a
Senior Vice President at Kenmark Group, and leads the
Controls Division. Kenmark Controls is a LonMark Certified
Integrator and has provided installation, management, and consulting on
millions of square feet of controls implementations. Wayne has
authored articles about managing large controls projects and
innovative, cross-functional controls implementations. Please go
to http://kenmark.com/team/wayne-wiebe/
or
http://www.linkedin.com/pub/wayne-wiebe/0/755/12b
for more
information.
[an error occurred while processing this directive]
[Click Banner To Learn More]
[Home Page] [The Automator] [About] [Subscribe ] [Contact Us]