|
May 2017
AutomatedBuildings.com
|
[an error occurred while processing this directive]
(Click
Message to Learn More)
|
Does Building Energy Analytics
Really Work?
Although we
did not cover how building analytics could be used for improving
occupant comfort, the answer is an emphatic Yes! Additionally,
once the optimization measures are implemented, and faults in the
building are addressed, building analytics ensures that equipment
operation does not revert back to the “old ways.”
|

Derek John Mullassery,
Building Application Engineer
CopperTree
Analytics
|
Introduction
The Internet of Things (IoT) industry is
poised to grow to US$ 3.7 billion by 2020, and smart building energy
analytics applications are expected to contribute to this growth
significantly. Lawrence Berkeley National Laboratory predicts the
spending on energy efficiency programs to more than double from 2010 levels to $10.8 billion in
2025, with a possibility to grow to $16.8 billion. These numbers
are just pointers to the fact that organizations and governments are
going to increase their investments in energy efficiency projects and
applications. The Smart Energy Analytics Campaign by the US
Department of Energy is an example – this program aims to bring
building analytics into the mainstream and enable building owners to
operate and maintain their buildings more efficiently.
Can building energy analytics actually
reduce your energy consumption and operational costs? Can it improve
occupant comfort in the building leading to occupant well-being?
Project Feedback
This is a project feedback on how a major hospital in North America used CopperTree
Analytics’ Kaizen building energy analytics solution to improve
their building performance. While the results of the Kaizen
implementation included identification of several potential energy
savings opportunities, realized cost savings from energy efficiency
initiatives, and improvements in comfort & maintenance procedures,
this article focuses on just one of the major findings by CopperTree
Kaizen.
CopperTree’s Kaizen solution was deployed
in the building in October 2016. In just a matter of one day, Kaizen’s
Automated Fault Detection & Diagnostics (AFDD) engine generated
insights that pointed to faults in the building.
There are 18 large Air Handling Units (AHUs) in
the building, and Building Automation System data from these AHUs are
sent to Kaizen for continuous monitoring and analytics. Right after the
equipment Trend Log data arrived in Kaizen, Kaizen identified that the
AHU Supply Static Pressure Setpoints were not being reset. Even though
the AHUs are supplying Variable Air Volume (VAV) boxes, the variable
frequency drive supply fans were consistently running at high speeds.
Simultaneously, another AFDD rule monitoring the
VAV boxes detected that there were long periods of the day and night
operation when the VAV boxes were supplied more air than required
(airflow above setpoint). As a first step to evaluate the system
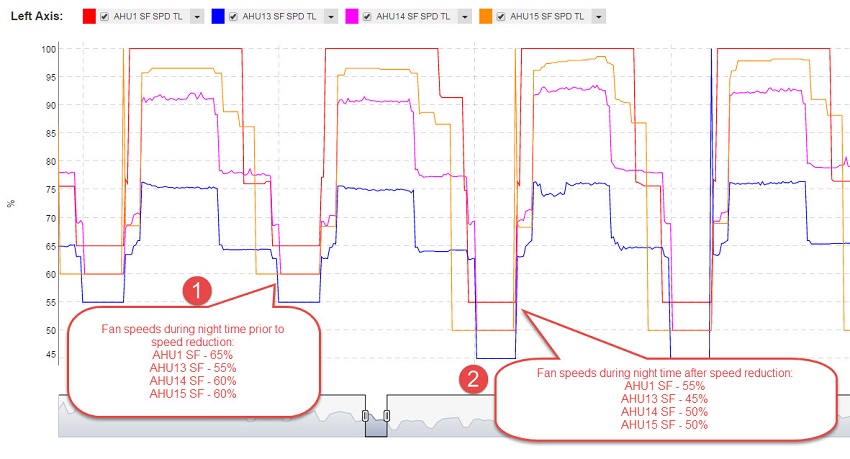
operation, CopperTree Analytics proposed a speed reduction strategy on
4 out of 18 AHUs in the building. The supply fan speeds were reduced
between 11 pm and 5 am to determine if the airflow requirements would
still be maintained.

Figure 1:
Comparison of Fan Speeds
Before and After Recommended
Sequence Change
Rules were implemented on the units
to
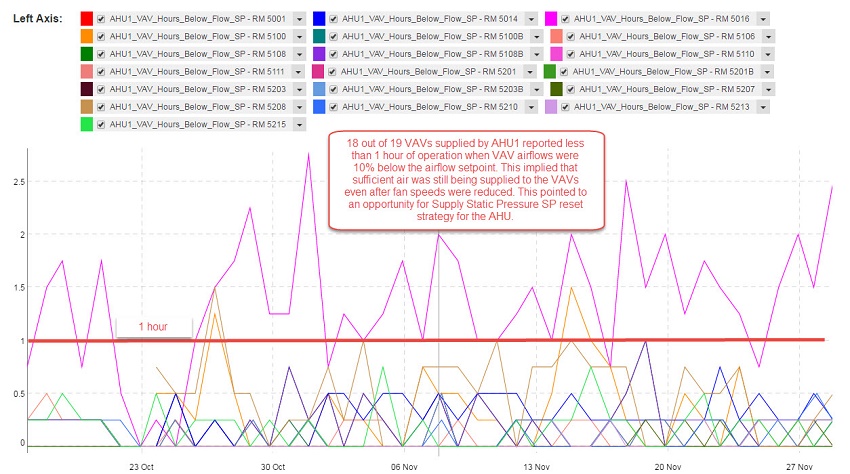
determine the total number of hours when the VAV airflows were less
than the airflow setpoint while the fan speed reduction program was
active. The results indicated that more than 92% of the VAVs were still
being supplied enough airflow even when the fan speeds were reduced.
For instance, 18 out of 19 AHU1 VAVs were reporting less than 1 hour of
operation below airflow setpoint.
Figure 2: VAVs
Reported Sufficient Airflow
After Fan Speed Reduction
This proved
that Supply Static Pressure
Setpoint reset based on VAV demand could improve the AHU operation
while making sure that all the operating conditions were being
satisfied. The optimized program would count the number of VAVs short
of airflow, and if the total count was greater than the threshold, the
Supply Static Pressure Setpoint would be increased. This would ramp up
the supply fan speed in order to maintain the VAV airflow requirements.
The system would correct itself every 3-5 minutes, and if the VAV
dampers are seen to be closing, which is indicative of reduced need of
airflow, then the Supply Static Pressure Setpoint would be reduced. To
summarize, the optimized program implements a Supply Static Pressure
Setpoint reset strategy that continually monitors airflow requirements
of all VAV boxes supplied by the AHU.
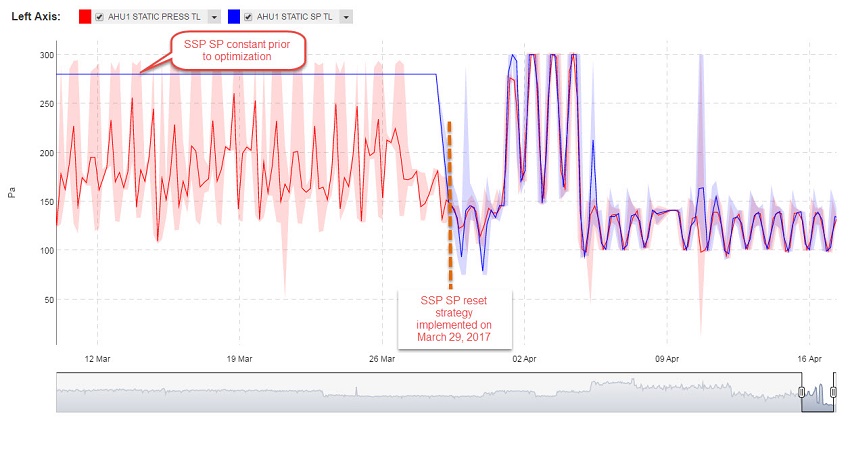
CopperTree proposed that the Supply Static
Pressure Setpoint reset strategy be implemented on AHU1 as a proof of
concept project. The operations team at the hospital agreed to
implement this strategy, and the control program was optimized on March
29, 2017.
Figure 3: Supply Static Pressure Setpoint Before
and After
Implementation of Reset Strategy
It was important to measure and verify the
results from AHU1 before optimizing the program for the remaining AHUs.
CopperTree Kaizen’s Energy and Reporting features were used for
Measurement & Verification (M&V). Energy and Cost Analysis
rules were implemented to calculate the AHU consumption and compare
post-optimization consumption with the baseline. Figure 4 below shows
the realized savings (see CUSUM Cost Savings Trend Log) for AHU1 from
the first two weeks of operation since optimization. The results
indicate that the hospital is expected to save approximately $6000 annually from just one AHU.
Figure 4: Realized Cost Savings from
Implementing Supply Static
Pressure Setpoint Reset Strategy on AHU1
After verifying the success of the project
on AHU1, the hospital is now moving ahead with the recommendation to
implement this strategy on all of the AHUs in the building. The
estimated cost savings from this measure on all the AHUs combined is
approximately $50,000 annually.
Added to this energy saving measure, CopperTree Analytics’ Kaizen has
identified several other opportunities to save energy, reduce
maintenance costs, and improve occupant comfort in the building.
Conclusion
Now, back to
the questions. Can building energy analytics reduce your energy
consumption and operational costs? Can it improve occupant comfort in
the building which in turn results in occupant well-being? Although we
did not cover how building analytics could be used for improving
occupant comfort, the answer is an emphatic Yes! Additionally,
once the optimization measures are implemented, and faults in the
building are addressed, building analytics ensures that equipment
operation does not revert back to the “old ways.”
Over and over again, our clients from around the
world are making the most of the features in CopperTree Kaizen to
improve their building performance and operation significantly.
Building energy analytics will play a very important role as we march
towards a sustainable future.
About the Author:
Derek John Mullassery is a Building
Application Engineer at CopperTree Analytics. He holds a Master’s
degree in Clean Energy Engineering from the University of British
Columbia, Vancouver and an undergraduate degree in Electrical
Engineering from India. Derek’s interests include data analytics for
building performance improvement, controls optimization, energy
management, and behavioral change programs for occupants and operators.
Additional information about CopperTree
Analytics:
Website: www.coppertreeanalytics.com
CopperTree Analytics Overview
footer
[an error occurred while processing this directive]
[Click Banner To Learn More]
[Home Page] [The
Automator] [About] [Subscribe
] [Contact
Us]


