September 2009
![]()
AutomatedBuildings.com
[an error occurred while processing this directive]
(Click Message to Learn More)
September 2009 |
[an error occurred while processing this directive] |
|
|
Sarah Erdman, |
As sustainable building increases, so does the need to educate the public about the importance of sustainability and energy efficiencies. With improved sustainable materials and more government funding available, health care, education and offices are expected to be the building industry’s largest areas for new nonresidential green construction, according to FMI’s 2008 U.S. Construction Overview.
|
|
|
|
|
|
|
|
|
|
|
|
|
[an error occurred while processing this directive] |
|
|
|
|
|
|
|
|
|
|
|
|
|
|
|
[an error occurred while processing this directive] |
 Once
built, facilities want to see how energy efficient the buildings are, and share
this information with building occupants, visitors and the public. Displaying a
building’s energy efficiencies or sustainable practices is a trend seen more and
more in the green building industry. Using a solution such as an Energy
Efficiency Education Dashboard (EEED) provides details on the building’s energy
efficiencies in a fast and easy to understand format. It can also help earn an
Innovation in Design LEED certification credit from the U.S. Green Building
Council (USGBC).
Once
built, facilities want to see how energy efficient the buildings are, and share
this information with building occupants, visitors and the public. Displaying a
building’s energy efficiencies or sustainable practices is a trend seen more and
more in the green building industry. Using a solution such as an Energy
Efficiency Education Dashboard (EEED) provides details on the building’s energy
efficiencies in a fast and easy to understand format. It can also help earn an
Innovation in Design LEED certification credit from the U.S. Green Building
Council (USGBC).
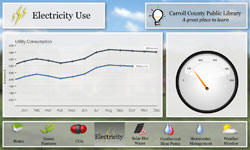
An EEED is a graphical user interface (GUI) that displays a building’s resource
use in real-time by “talking” to a building’s automation system. It not only
shows energy efficiencies, but serves as an educational tool that provides more
information about the green features used throughout the building,
photo-realistic graphics, company information and more. The Energy Efficiency
Education Dashboard is offered by Quality Automation Graphics, an innovative
leader in the design of user interfaces. This solution has been utilized by
schools, a state capitol complex, libraries, a new McDonald’s restaurant, and is
in the development process for several universities.
 A
recent example is an EEED created for the new Finksburg Branch of the Carroll
County Public Library in Maryland. The Finksburg Branch opened earlier this year
and is one of the first green buildings in Carroll County. Displayed in the
library’s lobby, the Finksburg Branch is using the EEED to educate staff and
patrons on the new building’s energy efficiencies, carbon footprint and green
initiatives.
A
recent example is an EEED created for the new Finksburg Branch of the Carroll
County Public Library in Maryland. The Finksburg Branch opened earlier this year
and is one of the first green buildings in Carroll County. Displayed in the
library’s lobby, the Finksburg Branch is using the EEED to educate staff and
patrons on the new building’s energy efficiencies, carbon footprint and green
initiatives.
“We’re delighted with the product both technically and artistically. It’s so
gratifying to see kids interacting with the dashboard and learning how we are
helping our environment,” said Scott Reinhart, the assistant director of Carroll
County Public Library.
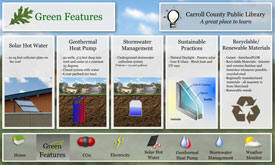
The information is presented in an easy to understand format, similar to a Web
site, on an interactive touchscreen to show users the library’s energy
consumption in real-time. Users can also check the weather and learn more about
the library’s various green features, including a geothermal heat pump, storm
water management, solar hot water and recyclable materials. Quality Automation
Graphics worked with Johnson Controls, a global leader in building efficiency
and power solutions, to integrate the EEED with the library’s control system.
If you’re interested in learning how you can use the Energy Efficiency Education
Dashboard as a green education tool, visit
http://www.qagraphics.com/interactive-development/energy-efficiency-education-dashboard
or contact Sarah Erdman, marketing director of Quality Automation Graphics at
serdman@qagraphics.com.
[an error occurred while processing this directive]
[Click Banner To Learn More]
[Home Page] [The Automator] [About] [Subscribe ] [Contact Us]