|
March 2015
Article
AutomatedBuildings.com
|
[an error occurred while processing this directive]
(Click
Message to Learn More)
|
|
From Buildings to Campuses to Cities
and Beyond…
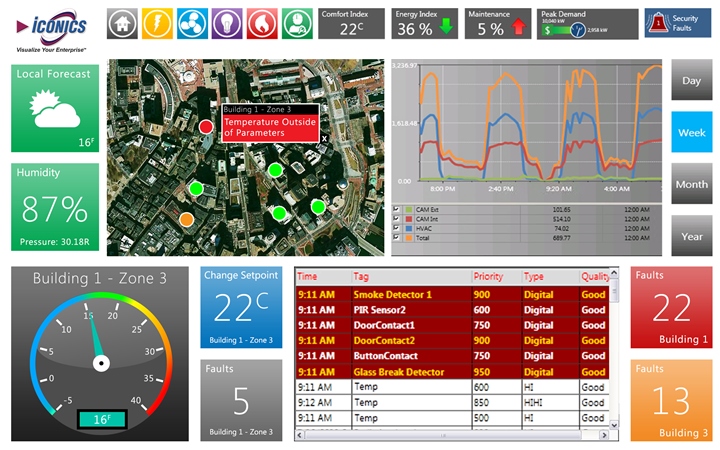
We specialize in graphically
representing the collected data on a
desktop, browser or mobile device to allow building operators and
managers to
optimize their business processes.
|

Melissa Topp
Director of Global Marketing
ICONICS, Inc
|
The
company I work for, ICONICS, has a few decades of experience in the
acquisition, visualization, alarming, trending and, more recently,
in-depth analysis of data; data that mostly came from devices connected
to big industrial equipment performing automated manufacturing tasks.
We specialize in graphically representing the collected data on a
desktop, browser or mobile device to allow operators and managers to
optimize their business processes. They also used that data to analyze
trends over time as well as to notify them with alarms if any part of
the process didn’t follow set parameters.
These prudent uses of both real-time and historical data have provided
enormous cost savings for companies and organizations around the globe
as well as led to a multitude of process improvements. With such
realizations, it was only a matter of time before these concepts found
their way to the building controls industry. Facility managers,
building operators or anyone with responsibility for a physical
location could now apply these same data-driven improvements.
Make Scaling Your Company’s Goal
To draw an analogy from the manufacturing side to the building controls
industry, follow along with this example. For manufacturers, one single
connected device provides the basis for process control. It gets
physically connected to a network, where the control software
recognizes it and can then use its data for graphical representation,
trending, alarming and more. Of course, that device is usually joined
by many others to represent a single process; for example, the
manufacturing process for a single physical item or widget.

So you have a control system for your
manufacturing assembly process in
one floor of your factory. Success and expansion to other product lines
could necessitate connecting all the devices related to the entire
product family. Still, that might just be an additional floor of your
factory and, depending on your software provider, the control software
easily scales. Now let’s say the demand for your product necessitates a
whole additional factory nearby. Scalable control software handles this
easily. Let’s say the company branches out internationally to dozens of
factories across the world. You’re a global enterprise now and,
depending on your software provider, your control software has easily
scaled from those days of single devices to millions of connected tags,
providing the lifeblood of your entire product portfolio: data.
Building Blocks of Facility-based
Savings
Now to relate this example to what ICONICS has achieved on the building
automation and energy management side, there are dozens of different
processes taking place in buildings everywhere day after day. These
include heating, ventilation, air conditioning, lighting, energy
monitoring, physical security, fire safety, elevator use and more.
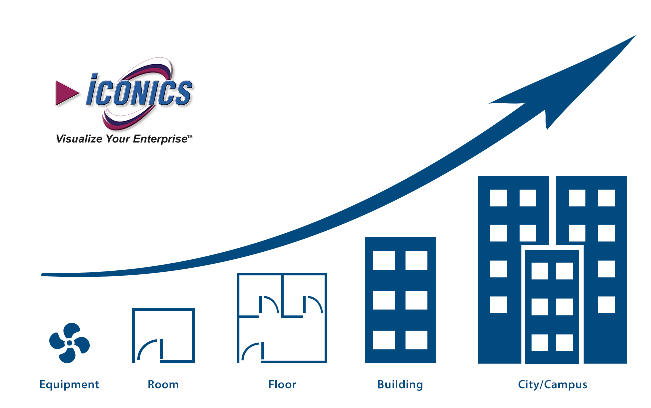
Similar to the manufacturing example, such processes can start out
small; maybe initially applied to one room in a single building. The
considered usefulness of the data might then warrant expansion out to
an entire floor, then another, then maybe through an entire building.
Additional processes are added in a similar rollout, where the single
building’s use case leads to expansion to an entire campus. It is
possible for such initiatives to get adopted by an entire city or even
country-wide.

Such a scenario is not some delusion of
grandeur. It has been achieved,
and by none other an organization than Microsoft.
Microsoft sought a way to reduce energy
spending at its 500-acre
Redmond, Washington headquarters. An internal team advised against the
company spending $60 million to address the concern and to rather use
commercial, over-the-shelf software. A test run of the team’s plans was
performed within 13 of 125 buildings. The team utilized the selected
control software to tie multiple disparate building management systems
together, providing multiple points of data to analyze. It gave
Microsoft the means to see 30,000 unconnected, sensor-enabled pieces of
equipment as a cohesive whole generating over half a billion data
transactions every single day; but in a way that was easier to manage
and understand.
The data provided to Microsoft’s Redmond Operations Center (ROC) was
enormously valuable, reporting on inefficiencies involving lighting
schedules, air conditioning, heating and more. The test case was soon
rolled out into the entirety of Microsoft’s Redmond campus, now
handling billions of data points to visualize, analyze and improve.
[an error occurred while processing this directive]
In addition to the immediate savings seen due to the selected
software’s energy management capabilities, Microsoft also saw savings
by implementing fault detection and diagnosis (FDD) features, as well.
What FDD provides is the ability to incorporate user customizable fault
rules to weigh the probability of equipment failure and to advise
personnel of immediate preventative actions they can take before faults
occur. When equipment failures occur, the software analyzes current and
historical information along with symptom/cause relationships that the
system has been taught, executes predictive algorithms, and provides
the user guidance with a list of probable causes sorted by probability.
This immediate guidance reduces mean time to diagnose and repair,
reduces equipment downtime, and lowers overall maintenance costs.
For engineers at Microsoft’s Redmond campus this means less time
“climbing over rooftops, inspecting pump rooms and peering above
ceiling tiles” and more time spent proactively where actual problems
could occur, further contributing to cost savings. With combined energy
and FDD analysis capabilities, the company reduced its energy
consumption/costs, extended the life of its building assets, drives
continuous labor efficiencies, and shrunk its carbon footprint.
Microsoft now saves into the millions of dollars annually just at their
Redmond campus, with further rollout planned throughout their worldwide
locations.
About the Author
Melissa Topp is the Director of Global Marketing
for ICONICS, a
world-leading software developer of open standards-based visualization,
HMI/SCADA and enterprise solutions for energy, industrial,
manufacturing and building automation. With more than 300,000
installations worldwide, ICONICS, the Microsoft CityNext and
Sustainability Partner of the Year, helps its customers be more
profitable, agile, efficient and sustainable. Melissa has a B.S. in
Computer Science and Management Information Systems from Worcester
Polytechnic Institute and over 12 years of industry experience.
About
ICONICS
ICONICS, a globally managed Microsoft Gold Partner, 2014 Microsoft
Public Sector CityNext Partner of the Year Award Winner and past
recipient of the Microsoft Sustainability Partner of the Year award,
provides solutions to improve productivity, reduce integration time and
operating costs, and optimize asset utilization with visualization and
automation software. Founded in 1986, ICONICS has 300,000 installations
in over 60 countries worldwide. ICONICS software is recommended for
automating, monitoring and optimizing a customer’s most critical assets
and has been selected by over 70 percent of Fortune 500 companies.
ICONICS meets the demanding application challenges of the automotive,
building automation, food and beverage, government infrastructure,
manufacturing, petrochemical, pharmaceutical, renewable energy,
utilities and water/wastewater industries. As a managed Microsoft ISV
Partner, ICONICS designs its solutions to leverage Microsoft
technologies, including Windows 8, Windows Server 2012, Microsoft .NET,
Windows Azure, SQL Server and Microsoft SharePoint.
footer
[an error occurred while processing this directive]
[Click Banner To Learn More]
[Home Page] [The
Automator] [About] [Subscribe
] [Contact
Us]


